Productivity
Best Multi-Source Data Integration BI Tools in December 2025
Compare the best multi-source data integration BI tools in December 2025. Index, Looker, Tableau, Domo, and Power BI reviewed for cross-source queries and SaaS connectors.

When was the last time you needed to join Salesforce data with your production database and actually got an answer in under an hour? If you're like most teams, that question either requires a custom ETL pipeline or never gets answered at all. SaaS data connectors that plug directly into your existing sources change that equation. You connect your apps and databases once, then query them together without building infrastructure first.
TLDR:
Multi-source BI connects databases and SaaS apps directly without ETL pipelines or warehouses.
Legacy tools like Tableau and Looker require weeks of modeling before you can query data.
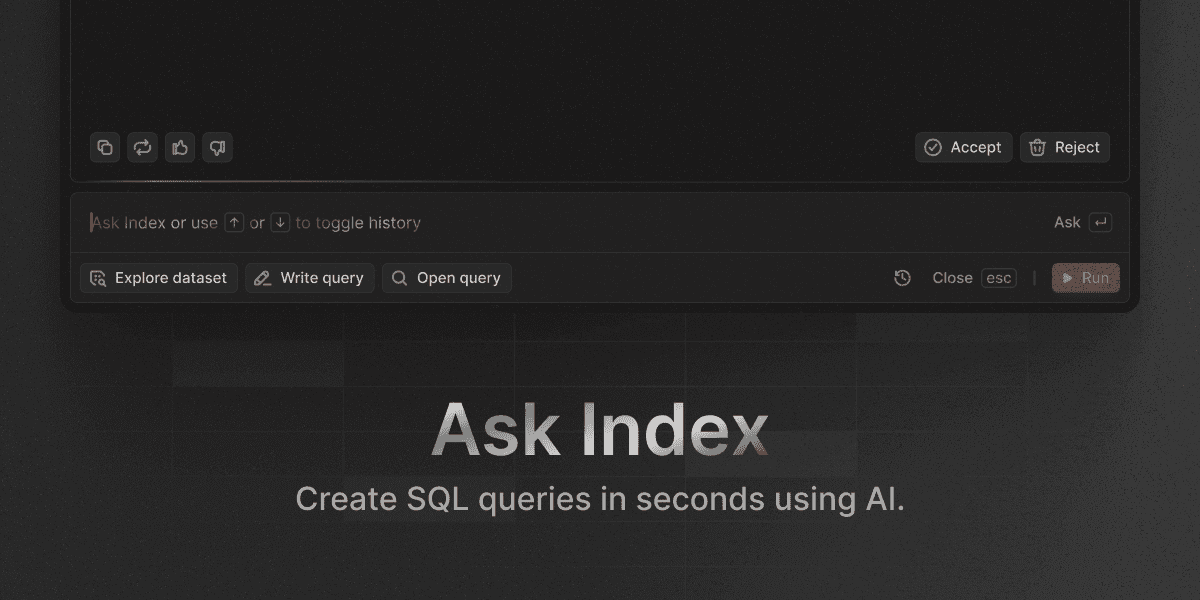
Index queries live data across sources in minutes using AI to map schemas and handle joins.
Most platforms force a tradeoff between connector breadth and query speed; Index removes it.
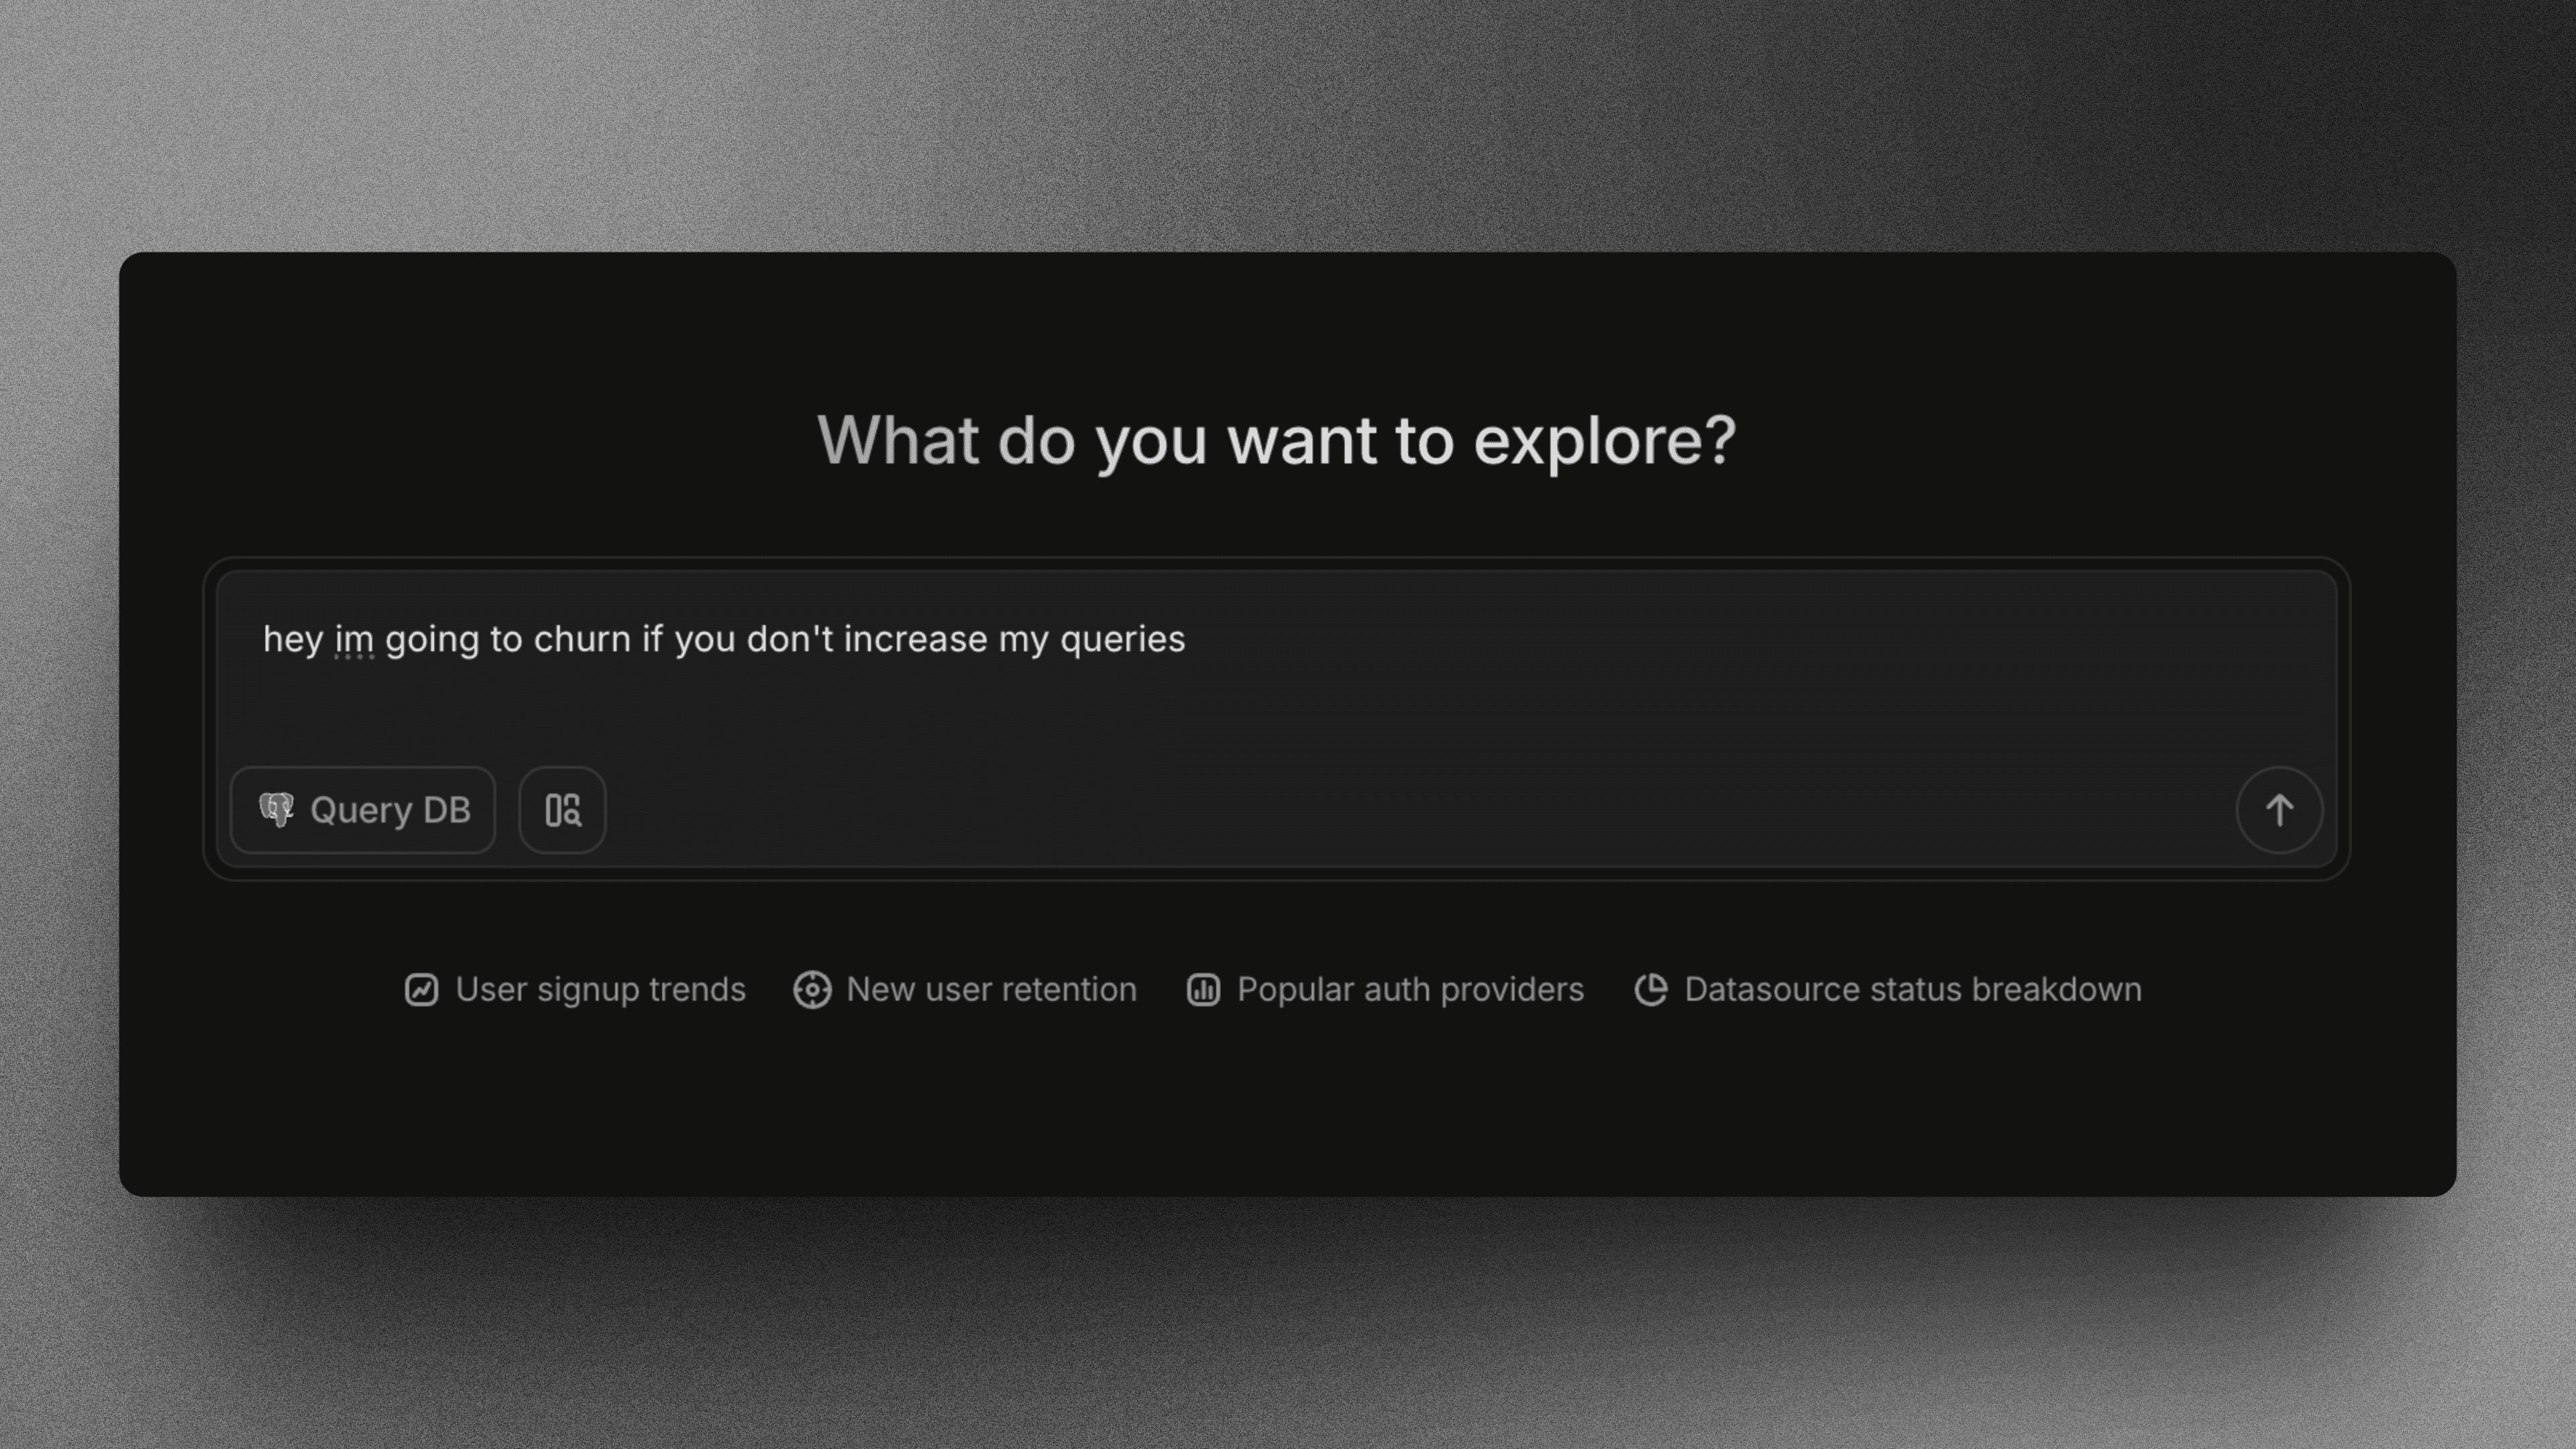
Index lets non-technical users ask cross-source questions in plain English without SQL.
What is Multi-Source Data Integration for BI?
Most teams run in the dark. Payment data sits in Stripe. App logs rot in Postgres. Sales context dies in Salesforce.
Multi-source BI forces these disjointed systems to talk. Organizations spend 12 hours weekly chasing data across disconnected systems, while employees lose 60-80% of their time on manual ETL maintenance. It builds a unified analytics tool where revenue metrics are tied directly with product usage.
You stop opening five tabs to answer one question.
Old workflows relied on fragile ETL pipelines to move everything into a warehouse first. That is slow. Real speed requires native SaaS data connectors and direct database integration to query data where it resides. If your data integration tools cannot join your CRM with your production database, they fail at business intelligence. You have a visualization library.
How We Stress Tested Multi-Source Data Integration BI Tools
Connectivity determines utility. We focused on extensive native SaaS data connectors and standard database integration. You cannot wait on engineering tickets. If connecting Stripe takes custom code, walk away. Setup simplicity is non-negotiable.
Latency kills insights. We did a thorough study on real-time capabilities against rigid scheduled syncs. Connecting sources is easy. Querying them together is hard. If a cross-source query times out, the integration fails.
Raw data is garbage. We demanded built-in features to clean and model data before analysis. The global market is flooding with options, yet few multi-source BI tools handle complex joins efficiently. We demand answers. Dashboards come second.
Best Overall Multi-Source Data Integration BI Tool: Index
Data lives in silos. You have revenue in Stripe and product usage in Snowflake. Usually, joining these requires building brittle pipelines and waiting on engineers. Index removes the ETL layer. We connect directly to warehouses and SaaS apps in minutes.
The AI maps schemas and handles joins across sources automatically through its metric layer, managing schema evolution as your data structures change.
You ask questions, and the engine figures out how to merge the tables.
Key capabilities:
Zero-ETL architecture → Direct connections to sources like BigQuery, Postgres, and HubSpot mean you query live data without moving it into a central warehouse first.
Automated cross-source joins → The semantic engine identifies common keys across disparate datasets to merge records on the fly without complex SQL modeling.
Instant deployment → Pre-built connectors allow teams to visualize multi-source metrics like LTV/CAC immediately after connecting credentials.
Looker
Looker forces you into a marriage with LookML. It is a code-heavy environment where you speak their proprietary language. If you have the engineering resources, you get a single source of truth. If you do not, it is an empty shell.
LookML semantic layer → Defines business logic centrally, which makes sure every query uses the exact same metric definition.
Google Cloud native → Lives within the Google ecosystem, making it the default for BigQuery shops.
Governed database integration → Prevents metric divergence but forces a rigid development lifecycle on your team.
The brutal truth: You cannot simply connect SaaS data connectors like Stripe. Someone must write the LookML model first. It is a modeling environment, not a flexible data integration tool.
Bottom line: Looker excels at governance. Index excels at speed, delivering multi-source BI immediately without months of development.
Tableau
Tableau is the standard for static dashboards. It creates elite visualizations but demands heavy desktop software and strict extract management. The workflow assumes analysts have weeks to polish distinct views.
Native Database Integration → Supports standard SQL sources out of the box, though API connections often require brittle drivers.
Desktop Authoring → Granular aesthetic control that forces local file dependencies and versioning headaches.
Tableau Prep → A mandatory separate tool for joining multi-source BI data before analysis can even begin.
The brutal truth: Visualization is not integration. Joining Salesforce data with Snowflake tables often breaks without rigid upstream modeling. Many SaaS data connectors are merely third-party wrappers that fail silently. Non-technical users cannot ask questions here. They wait for a ticket to clear.
Bottom line: Tableau owns design customization. Index owns speed to insight via natural language, removing the desktop dependency.
Domo
Domo rejects the separation of storage and compute. It pulls everything into a proprietary walled garden. With over 1,000 SaaS data connectors, it approaches multi-source BI through brute force.
Connector Volume → Prebuilt integrations cover niche tools and database integration.
Magic ETL → A visual builder for cleaning data without writing SQL.
The problem is the bloat. Magic ETL handles simple logic fine. It breaks under pressure. Complex joins or heavy incremental loads choke the visual builder. You pay for consumption and app dev features you likely ignore. It creates a heavy, expensive dependency just to get connectivity.
Power BI
Power BI is the default for Office 365 teams. It links tightly with Excel and Azure. It handles database integration well, provided you stay within the Microsoft ecosystem.
Native Connectivity → [120 connectors] cover standard SQL and enterprise apps.
Power Query → Deep ETL control, assuming you learn the M language.
DirectQuery → Live connections that theoretically bypass import limits.
The brutal truth: Multi-source BI is painful here. Joining non-Microsoft SaaS data connectors requires complex modeling. Get the schema relationships wrong, and the dashboard breaks. Licensing also limits impact. You pay per head just to view a chart.
Bottom line: Power BI wins for Microsoft-centric reporting. Index handles the ad-hoc cross-source questions without the modeling overhead or licensing headaches.
Feature Comparison Table of Multi-Source Data Integration BI Tools
Marketing pages lie. They show a wall of logos and hide the configuration nightmare. True connectivity measures time-to-insight, not connector count. Most legacy data integration tools demand heavy lifting: warehousing, ETL pipelines, and complex modeling. You spend weeks setting up infrastructure before answering a single question.
We studied the technical reality of merging SaaS data connectors with database integration to see who actually removes the friction.
Tool | Native Connectors | Architecture | Real-Time | Code Requirement | Time-to-Value |
|---|---|---|---|---|---|
Index | Database + SaaS | Direct Query | Yes | None (Natural Language) | Minutes |
Looker | Warehouse Only | Warehouse-Dependent | Yes | High (LookML) | Weeks |
Tableau | ~100 Sources | Extracts/Drivers | Mixed | High (Prep Flows) | Weeks |
Domo | 1,000+ Sources | Cloud Import | No (Cached) | Low (GUI Builder) | Days |
Power BI | ~120 Sources | Import/DirectQuery | Mixed | High (DAX/M) | Days |
Why Index is the Best Multi-Source Data Integration BI Tool
Legacy data integration tools force a brutal tradeoff. Breadth or speed. You get high latency with Domo or data trapped in a single ecosystem with Power BI.
Index removes that choice. We built an analytics architecture that bypasses the warehouse requirement entirely. Connect a database. Connect a SaaS app. You are live.
The difference isn't the chart. It is the plumbing. You do not model joins between Salesforce and Snowflake manually. Our AI detects relationships and queries sources live.
Zero-ETL architecture: We query data where it lives without moving it or building pipelines.
Automated mapping: The semantic engine maps keys across disjointed sources instantly.
Natural language analysis: Non-technical users run cross-source analysis without SQL.
Weeks of modeling become minutes of setup.
Final thoughts on multi-source business intelligence tools
Most SaaS data connectors promise integration but deliver configuration nightmares. You need a tool that queries live data across sources without moving it first. Your team asks questions in natural language, and the engine handles the joins. Stop modeling. Start asking.
FAQ
How do I choose the right multi-source BI tool for my team?
Start with your technical capacity and time constraints. If you have dedicated engineers and need strict governance, Looker's LookML approach works. If you need instant cross-source analysis without coding or ETL pipelines, Index connects live data in minutes through natural language queries.
Which multi-source BI tool works best for non-technical users?
Index removes the SQL and modeling barrier entirely through AI-powered natural language queries. Power BI and Domo offer visual builders but still require understanding data relationships and schema design. Tableau and Looker assume analyst-level technical skills.
Can I query data across different sources without building a data warehouse first?
Yes, but most tools cannot. Index uses a zero-ETL architecture that queries databases and SaaS apps directly where they live. Legacy tools like Looker, Tableau, and Domo require moving data into a central warehouse or proprietary system before analysis.
What's the difference between connector count and actual integration capability?
Connector count is marketing. Real integration measures how fast you can join data across sources. Domo lists 1,000+ connectors but chokes on complex cross-source joins. Index has fewer connectors but automatically maps schemas and handles live joins across disparate systems without manual modeling.
How long does setup typically take for multi-source BI tools?
Index connects and delivers insights in minutes through pre-built connectors and automated schema mapping. Looker requires weeks of LookML development. Tableau and Power BI need days of extract configuration and relationship modeling. Domo sits in between at several days for Magic ETL setup.