Productivity
200+ KPI Examples by Department and Industry (January 2026)
200+ KPI examples across 15 departments with formulas and benchmarks. Financial, sales, marketing, operations, SaaS, retail, and more. January 2026 guide.

Most teams measure too much and act on too little. You'll see dashboards packed with 40 metrics when the business really turns on five. We built this guide to help you cut through that noise: 200+ KPI examples organized by department and industry, with formulas and context so you know which ones actually drive decisions. With conversational BI, you can query these metrics in plain English without writing SQL.
The difference between a KPI and a vanity metric is simple. A KPI tells you whether to change course, add resources, or double down. A vanity metric just looks good in a deck. We'll walk through financial, sales, marketing, customer success, HR, operations, IT, manufacturing, supply chain, healthcare, SaaS, retail, and project management indicators so you can focus on the numbers that move your business forward.
TLDR:
This guide covers 200+ KPIs across 15 departments with formulas and use cases for each metric.
Financial, sales, and marketing KPIs connect daily operations to revenue outcomes and ROI.
Operations and supply chain indicators expose hidden costs in waste, downtime, and inventory.
SaaS metrics like NRR above 110% prove your customer base grows revenue without new logos.
Index delivers instant customer-facing dashboards through plain-English queries, no SQL required.
Understanding KPIs: Definition and Core Concepts
A KPI is a quantifiable measure that tracks progress toward a specific business objective. The distinction matters: every KPI is a metric, but not every metric qualifies as a KPI.
Metrics are measurements. KPIs are measurements that directly inform strategic decisions. Revenue per customer is a metric. Monthly recurring revenue growth tied to your expansion goal is a KPI.
Effective KPIs follow SMART criteria: Specific, Measurable, Achievable, Relevant, and Time-bound. This framework separates indicators that drive action from vanity numbers that look good in slides but change nothing.
You'll also encounter two types of indicators. Leading indicators predict future performance (pipeline velocity, trial sign-ups). Lagging indicators confirm what already happened (closed revenue, churn rate). The best KPI frameworks balance both.
Financial KPIs
Financial indicators show whether your business model works at scale. These metrics connect daily operations to balance sheet outcomes.
The table below covers the core financial KPIs finance leaders track:
KPI | What It Measures | Formula |
|---|---|---|
Revenue Growth Rate | Sales velocity period over period | ((Current Period Revenue - Prior Period Revenue) / Prior Period Revenue) × 100 |
Gross Profit Margin | Revenue left after direct costs | ((Revenue - COGS) / Revenue) × 100 |
Net Profit Margin | Bottom-line profitability | (Net Income / Revenue) × 100 |
EBITDA | Operating performance before financing decisions | Earnings Before Interest, Taxes, Depreciation, Amortization |
Operating Cash Flow | Cash generated from core operations | Net Income + Non-Cash Expenses - Changes in Working Capital |
Current Ratio | Short-term liquidity health | Current Assets / Current Liabilities |
Quick Ratio | Liquidity without inventory | (Current Assets - Inventory) / Current Liabilities |
Debt-to-Equity Ratio | Financial leverage | Total Debt / Total Equity |
Return on Assets | Asset utilization efficiency | (Net Income / Total Assets) × 100 |
Return on Equity | Profitability to shareholders | (Net Income / Shareholder Equity) × 100 |
Accounts Receivable Turnover | Collection efficiency | Net Credit Sales / Average Accounts Receivable |
Days Sales Outstanding | Average collection period | (Accounts Receivable / Revenue) × Number of Days |
Working Capital | Operational liquidity buffer | Current Assets - Current Liabilities |
Burn Rate | Monthly cash consumption | (Starting Cash - Ending Cash) / Number of Months |
Customer Acquisition Cost | Cost to acquire one customer | Total Sales & Marketing Spend / New Customers Acquired |
Sales KPIs
Sales indicators measure conversion rates, pipeline health, and revenue predictability. They expose where deals stall and help you forecast cash flow accurately.
KPI | What It Measures | Formula | When to Use |
|---|---|---|---|
Monthly Recurring Revenue (MRR) | Predictable monthly subscription income | Sum of All Monthly Subscription Revenue | Subscription or SaaS business models |
Annual Recurring Revenue (ARR) | Normalized yearly recurring income | MRR × 12 | Long-term revenue planning and valuation |
Sales Growth Rate | Revenue acceleration or deceleration | ((Current Period Sales - Prior Period Sales) / Prior Period Sales) × 100 | Quarterly or annual reviews |
Average Deal Size | Typical contract value | Total Revenue / Number of Closed Deals | Pricing strategy and segment targeting |
Win Rate | Close rate across all opportunities | (Deals Won / Total Opportunities) × 100 | Sales process optimization |
Sales Cycle Length | Days from first contact to close | Average Days from Lead Creation to Deal Close | Pipeline forecasting and capacity planning |
Lead-to-Customer Conversion Rate | Top-of-funnel conversion | (New Customers / Total Leads) × 100 | Marketing and sales alignment |
Quota Attainment | Rep performance against target | (Actual Sales / Sales Quota) × 100 | Compensation and territory planning |
Pipeline Velocity | Speed of revenue generation | (Number of Opportunities × Average Deal Value × Win Rate) / Sales Cycle Length | Revenue forecasting |
Customer Lifetime Value (CLV) | Total revenue per customer | Average Purchase Value × Purchase Frequency × Customer Lifespan | Acquisition spend justification |
New vs. Expansion Revenue | Growth source breakdown | New Customer Revenue / Expansion Revenue from Existing Customers | Resource allocation decisions |
Sales by Territory | Geographic performance | Total Sales per Defined Geographic Area | Territory design and quota setting |
Revenue per Customer | Account value | Total Revenue / Number of Active Customers | Pricing and packaging decisions |
Churn Rate | Customer retention failure | (Customers Lost / Starting Customers) × 100 | Retention strategy validation |
Upsell and Cross-Sell Rate | Expansion revenue mix | (Expansion Revenue / Total Revenue) × 100 | Account management effectiveness |
Pipeline velocity combines four variables into one forward-looking number. It tells you how fast revenue will land before deals actually close.
Marketing KPIs
Marketing indicators connect campaign spend to revenue. They show which channels deliver qualified pipeline and which burn budget without return.
KPI | What It Measures | Formula | When to Use |
|---|---|---|---|
Cost Per Lead (CPL) | Investment per lead acquired | Total Marketing Spend / Number of Leads Generated | Channel budget allocation |
Marketing Qualified Leads (MQL) | Leads meeting engagement criteria | Count of Leads Passing MQL Threshold | Marketing-to-sales handoff optimization |
Cost Per Acquisition (CPA) | Full cost to acquire a customer | Total Marketing Spend / New Customers Acquired | ROI validation and channel mix |
Return on Ad Spend (ROAS) | Revenue per ad dollar | Revenue from Ads / Ad Spend | Paid campaign profitability |
Website Traffic | Total site visitors | Unique Visitors per Time Period | Top-of-funnel health |
Traffic-to-Lead Ratio | Site conversion rate | (Leads / Website Visitors) × 100 | Landing page and form optimization |
Conversion Rate by Channel | Performance per acquisition source | (Conversions / Visits per Channel) × 100 | Budget reallocation decisions |
Email Open Rate | Subject line effectiveness | (Emails Opened / Emails Delivered) × 100 | Campaign messaging validation |
Click-Through Rate (CTR) | Engagement with content or ads | (Clicks / Impressions) × 100 | Creative and copy testing |
Bounce Rate | Single-page visit percentage | (Single-Page Sessions / Total Sessions) × 100 | Content relevance checks |
Social Media Engagement | Audience interaction intensity | Likes + Comments + Shares per Post | Content resonance |
Brand Awareness | Unaided or aided recall | Survey-Based Metric or Search Volume | Long-term positioning |
Lead Generation Rate | New lead velocity | New Leads per Time Period | Campaign momentum |
Customer Acquisition Cost (CAC) | Blended acquisition investment | (Sales + Marketing Spend) / New Customers | Unit economics validation |
Marketing ROI | Overall marketing returns | ((Revenue from Marketing - Marketing Cost) / Marketing Cost) × 100 | Budget justification |
Cost per lead alone is a trap. A channel with high CPL but strong close rates often beats cheap traffic that never converts.
Customer Success and Service KPIs
Customer success indicators measure retention and account expansion. Track these metrics to spot churn risk before renewals come up.
KPI | What It Measures | Formula | When to Use |
|---|---|---|---|
Net Promoter Score (NPS) | Loyalty and referral intent | % Promoters (9-10) - % Detractors (0-6) | Quarterly brand health |
Customer Satisfaction Score (CSAT) | Interaction-level satisfaction | (Satisfied Responses / Total Responses) × 100 | Post-interaction surveys |
Customer Retention Rate | Account renewal success | ((Customers at Period End - New Customers) / Customers at Period Start) × 100 | Renewal forecasting |
Customer Effort Score (CES) | Problem resolution ease | Average Rating on Effort Scale (1-7) | Support process tuning |
First Response Time | Initial reply speed | Average Time from Ticket to First Response | SLA monitoring |
Average Resolution Time | Time to close tickets | Total Resolution Time / Resolved Tickets | Efficiency benchmarks |
Ticket Volume | Support demand | Total Tickets per Period | Staffing decisions |
Ticket Backlog | Unresolved queue size | Open Tickets at Period End | Resource gaps |
Escalation Rate | Complex issue frequency | (Escalated Tickets / Total Tickets) × 100 | Training needs |
Customer Health Score | Composite risk indicator | Weighted: Usage + Tickets + Payment + Engagement | Early warning system |
Renewal Rate | Contract continuation | (Renewed Contracts / Expiring Contracts) × 100 | Revenue predictability |
Support Cost Per Ticket | Unit economics | Total Support Costs / Ticket Count | Budget control |
Self-Service Resolution Rate | Knowledge base deflection | (Self-Solved Issues / Total Issues) × 100 | Deflection strategy |
Customer Expansion Rate | Existing account growth | (Expansion Revenue / Total Recurring Revenue) × 100 | Upsell performance |
Time to Value | Speed to first win | Days from Sign-Up to Key Milestone | Onboarding friction |
Health scores blend product usage with support volume. Declining logins plus rising ticket count signals risk weeks before a renewal call.
Human Resources and People KPIs
People metrics connect talent practices to business outcomes. These indicators track how well your organization attracts, develops, and keeps the workforce it needs.
Only 21% of employees strongly agree they have performance metrics within their control. Clear people KPIs make expectations measurable and progress visible.
KPI | What It Measures | Formula | When to Use |
|---|---|---|---|
Employee Retention Rate | Workforce stability | ((Employees at Period End - New Hires) / Employees at Period Start) × 100 | Annual planning and culture assessment |
Turnover Rate | Attrition frequency | (Departures / Average Headcount) × 100 | Retention program ROI |
Voluntary vs. Involuntary Turnover | Attrition type breakdown | Voluntary Exits / Total Exits | Exit pattern analysis |
Time to Hire | Recruiting velocity | Days from Job Post to Offer Acceptance | Hiring bottleneck identification |
Cost Per Hire | Recruiting investment | Total Recruiting Costs / New Hires | Budget allocation |
Offer Acceptance Rate | Candidate conversion | (Offers Accepted / Offers Extended) × 100 | Comp and employer brand validation |
Employee Satisfaction Score | Engagement intensity | Average Rating from Engagement Survey | Culture pulse checks |
Employee Net Promoter Score (eNPS) | Workplace referral intent | % Promoters (9-10) - % Detractors (0-6) | Quarterly culture health |
Absenteeism Rate | Unplanned absence frequency | (Days Absent / Total Workdays) × 100 | Burnout or disengagement signals |
Training Completion Rate | Development program adoption | (Completed Trainings / Assigned Trainings) × 100 | L&D effectiveness |
Training ROI | Learning investment return | (Performance Improvement Value - Training Cost) / Training Cost | Program continuation decisions |
Revenue Per Employee | Workforce productivity | Total Revenue / Headcount | Efficiency benchmarking |
Internal Promotion Rate | Career mobility | (Internal Promotions / Total Promotions) × 100 | Talent development success |
Diversity Metrics | Representation tracking | % by Gender, Ethnicity, Other Dimensions | Inclusion program progress |
Pay Equity Ratio | Compensation fairness | Median Pay by Group / Median Pay Overall | Equity audit and adjustment |
Operations and Process KPIs
Operations KPIs show where work slows and costs accumulate. Track these to catch bottlenecks before they break delivery schedules or tank margins.
KPI | What It Measures | Formula | When to Use |
|---|---|---|---|
Overall Equipment Effectiveness (OEE) | Asset utilization quality | Availability × Performance × Quality | Manufacturing efficiency benchmarks |
Defect Rate | Quality failure frequency | (Defective Units / Total Units Produced) × 100 | Quality control validation |
On-Time Delivery Rate | Schedule reliability | (Orders Delivered On Time / Total Orders) × 100 | Customer satisfaction and SLA compliance |
Order Fulfillment Time | End-to-end delivery speed | Average Days from Order to Delivery | Logistics optimization |
Cycle Time | Process completion duration | Time from Process Start to Finish | Workflow bottleneck identification |
Throughput | Production volume rate | Units Produced per Time Period | Capacity planning |
Capacity Utilization | Resource usage intensity | (Actual Output / Maximum Possible Output) × 100 | Asset investment decisions |
Inventory Turnover | Stock rotation velocity | Cost of Goods Sold / Average Inventory | Working capital management |
Lead Time | Supplier to production speed | Days from Order Placement to Receipt | Supply chain risk assessment |
Process Efficiency Ratio | Value-add vs. total time | (Value-Added Time / Total Process Time) × 100 | Lean improvement targeting |
Cost Per Unit | Production economics | Total Production Costs / Units Produced | Pricing and margin analysis |
Time to Market | Innovation velocity | Days from Concept to Launch | Competitive positioning |
First Pass Yield | Initial quality success | (Units Passed First Time / Total Units) × 100 | Rework cost reduction |
Downtime Percentage | Unplanned stoppage rate | (Downtime Hours / Planned Production Hours) × 100 | Maintenance strategy |
Order Accuracy Rate | Fulfillment precision | (Correct Orders / Total Orders) × 100 | Returns and support cost drivers |
Changeover Time | Setup speed | Minutes to Switch Between Products | Batch size optimization |
Scrap Rate | Material waste | (Scrap Weight / Total Material Input) × 100 | Cost reduction targeting |
Perfect Order Rate | Flawless execution | Orders Complete, On-Time, Damage-Free, Correct Invoice / Total Orders × 100 | End-to-end process health |
Cycle time shows where work stalls. Throughput tells you if that bottleneck matters to revenue. First pass yield exposes hidden rework costs that never appear on a production schedule.
Project Management KPIs
Project management indicators track delivery against scope, schedule, and budget constraints. These metrics expose risks early and help you decide where to add resources or cut scope.
KPI | What It Measures | Formula | When to Use |
|---|---|---|---|
Project Completion Rate | On-time delivery success | (Projects Completed On Time / Total Projects) × 100 | Portfolio health checks |
Budget Variance | Cost overrun or underrun | (Actual Cost - Planned Cost) / Planned Cost × 100 | Monthly financial reviews |
Schedule Variance | Timeline deviation | (Actual Duration - Planned Duration) / Planned Duration × 100 | Sprint or phase retrospectives |
Earned Value (EV) | Work completed value | % Complete × Total Budget | Progress tracking |
Cost Performance Index (CPI) | Budget efficiency | Earned Value / Actual Cost | Burn rate validation |
Schedule Performance Index (SPI) | Timeline efficiency | Earned Value / Planned Value | Forecast accuracy |
Resource Utilization Rate | Team capacity usage | (Billable Hours / Total Available Hours) × 100 | Staffing decisions |
Milestone Completion Rate | Key deliverable success | (Milestones Met / Total Milestones) × 100 | Stakeholder updates |
Scope Creep Percentage | Unplanned work growth | (Unapproved Changes / Original Scope) × 100 | Change control |
Risk Mitigation Effectiveness | Response success rate | (Risks Mitigated / Total Identified Risks) × 100 | Risk register reviews |
Stakeholder Satisfaction Score | Client or sponsor rating | Average Rating from Stakeholder Survey | Post-delivery assessment |
Defect Density | Quality issue concentration | Defects / Size of Deliverable | QA process tuning |
Time to Value | Benefit realization speed | Days from Project Close to First Measurable Impact | ROI validation |
Earned value combines scope, schedule, and cost into one metric. A CPI below 1.0 means you're over budget; an SPI below 1.0 means you're behind schedule.
IT and Technology KPIs
IT indicators measure system reliability, development velocity, and response times. These metrics expose infrastructure risks and show whether your tech stack supports business growth or blocks it.
KPI | What It Measures | Formula | When to Use |
|---|---|---|---|
System Uptime | Service availability | (Total Time - Downtime) / Total Time × 100 | SLA compliance and reliability tracking |
Mean Time to Repair (MTTR) | Incident resolution speed | Total Repair Time / Number of Incidents | Support efficiency and process improvement |
Mean Time Between Failures (MTBF) | System stability | Total Operating Time / Number of Failures | Infrastructure investment decisions |
Incident Resolution Time | Average fix duration | Total Resolution Time / Resolved Incidents | Team capacity and tooling gaps |
Bug Resolution Rate | Defect closure velocity | Bugs Resolved / Total Bugs Reported × 100 | Development quality and backlog health |
Deployment Frequency | Release cadence | Number of Deployments per Time Period | DevOps maturity and agility |
Change Failure Rate | Deployment risk | (Failed Changes / Total Changes) × 100 | Release process validation |
Code Quality Score | Technical debt indicator | Automated Analysis Tool Output | Refactoring prioritization |
Security Incident Response Time | Threat containment speed | Average Time from Detection to Resolution | Security posture assessment |
Server Response Time | Infrastructure performance | Average Time to Return HTTP Response | User experience optimization |
Help Desk Ticket Resolution Rate | Support closure success | (Resolved Tickets / Total Tickets) × 100 | Service desk effectiveness |
First Call Resolution Rate | Single-contact fix success | (Issues Resolved on First Contact / Total Issues) × 100 | Support quality and training needs |
Application Performance Index | User experience health | Composite: Response Time + Error Rate + Availability | End-user satisfaction proxy |
Infrastructure Cost Per User | Unit economics | Total Infrastructure Spend / Active Users | Scaling cost validation |
API Error Rate | Integration reliability | (Failed API Calls / Total API Calls) × 100 | Service dependency risk |
Deployment frequency without change failure rate is incomplete. High velocity with low failure proves process maturity. High velocity with high failure signals rushed releases.
Manufacturing and Production KPIs
Manufacturing KPIs track production efficiency, quality, and safety. These indicators expose hidden costs in material waste, machine reliability, and workforce safety that directly impact margin.
KPI | What It Measures | Formula | When to Use |
|---|---|---|---|
Production Volume | Total output quantity | Units Produced per Time Period | Capacity planning and forecasting |
Yield Rate | Usable output percentage | (Good Units / Total Units Started) × 100 | Process efficiency and material loss |
Rework Rate | Quality failure requiring correction | (Units Reworked / Total Units Produced) × 100 | Hidden labor cost identification |
Planned vs. Unplanned Maintenance Ratio | Preventive effectiveness | Planned Maintenance Hours / Unplanned Maintenance Hours | Maintenance strategy validation |
Takt Time | Customer demand pace | Available Production Time / Customer Demand | Production scheduling and line balancing |
Material Usage Variance | Raw material efficiency | (Actual Material Used - Standard Material) / Standard Material × 100 | Waste reduction targeting |
Safety Incident Rate | Workplace injury frequency | (Incidents × 200,000) / Total Hours Worked | OSHA compliance and culture health |
Machine Utilization Rate | Equipment availability | (Operating Time / Scheduled Time) × 100 | CapEx justification |
Quality Cost Ratio | Cost of poor quality | (Appraisal + Prevention + Failure Costs) / Total Sales × 100 | Quality program ROI |
Yield rate shows material loss. Rework rate reveals labor inefficiency. Together they expose the true cost of quality failures.
Supply Chain and Logistics KPIs
Supply chain indicators track delays, stockouts, and cost overruns from raw materials to final delivery. They help free working capital locked in excess inventory and reduce friction at every handoff.
KPI | What It Measures | Formula | When to Use |
|---|---|---|---|
Perfect Order Rate | Flawless end-to-end execution | Orders Complete, On-Time, Undamaged, Correct Documentation / Total Orders × 100 | Customer satisfaction and process health |
Freight Cost Per Unit | Shipping cost per item | Total Transportation Costs / Units Shipped | Rate negotiation and carrier selection |
Inventory Days on Hand | How long stock lasts | (Average Inventory / COGS) × 365 | Working capital and obsolescence risk |
Stockout Rate | Out-of-stock frequency | (Stockout Incidents / Total Demand Events) × 100 | Service level and safety stock planning |
Supplier On-Time Delivery | Vendor punctuality | (On-Time Deliveries / Total Deliveries) × 100 | Supplier scorecards and sourcing |
Warehouse Capacity Utilization | Storage space usage | (Used Space / Available Space) × 100 | Expansion planning and layout design |
Transportation Cost as % of Sales | Logistics burden | (Total Transportation Costs / Total Sales) × 100 | Network design and cost control |
Cash-to-Cash Cycle Time | Working capital speed | Days Inventory Outstanding + Days Sales Outstanding - Days Payable Outstanding | Liquidity and financing decisions |
Supplier Quality Rating | Incoming defect level | (Defective Units from Supplier / Total Units Received) × 100 | Vendor qualification |
Dock-to-Stock Time | Receiving speed | Average Hours from Arrival to Shelved | Warehouse throughput |
Cash-to-cash cycle time rolls inventory holding period, receivables collection, and payables delay into one number. Shorter cycles mean less cash tied up in the supply chain.
Healthcare KPIs
Healthcare KPIs track clinical outcomes, flow, and patient experience. Providers use these metrics to manage quality, resource allocation, and regulatory requirements.
KPI | What It Measures | Formula | When to Use |
|---|---|---|---|
Patient Satisfaction Score (HCAHPS) | Care experience rating | Average Survey Response (0-10 Scale) | Quality reporting and reimbursement |
Average Length of Stay (ALOS) | Days per admission | Total Patient Days / Number of Discharges | Capacity planning and cost control |
Bed Occupancy Rate | Facility utilization | (Occupied Bed Days / Available Bed Days) × 100 | Staffing and expansion decisions |
30-Day Readmission Rate | Post-discharge failure | (Readmissions Within 30 Days / Total Discharges) × 100 | Care transition quality and penalties |
Medication Error Rate | Prescription safety | (Medication Errors / Total Doses) × 100 | Patient safety and liability risk |
Patient Wait Time | Access speed | Average Minutes from Check-In to Provider Contact | Patient experience and throughput |
Treatment Success Rate | Clinical effectiveness | (Successful Outcomes / Total Treatments) × 100 | Protocol validation and outcomes |
Cost Per Patient | Unit economics | Total Care Costs / Number of Patients | Reimbursement adequacy |
Staff-to-Patient Ratio | Care capacity | Number of Clinical Staff / Number of Patients | Safety standards and burnout risk |
Emergency Department Throughput | ED speed | Average Minutes from Arrival to Disposition | Capacity constraints and diversion risk |
Hospital-Acquired Infection Rate | Preventable harm | (Infections / Patient Days) × 1,000 | Infection control programs |
Revenue Cycle Days | Billing speed | Days from Service to Payment | Cash flow and denial management |
Readmission rate carries financial penalties under CMS programs. High rates trigger reimbursement cuts and quality rating downgrades.
SaaS and Technology Company KPIs
SaaS companies measure growth through recurring revenue, user engagement, and expansion capacity instead of transactional volume.
KPI | What It Measures | Formula | When to Use |
|---|---|---|---|
Net Revenue Retention (NRR) | Revenue growth from existing customers | ((Starting MRR + Expansion - Contraction - Churn) / Starting MRR) × 100 | Validating expansion engine and account growth |
Gross Revenue Retention (GRR) | Revenue kept without expansion | ((Starting MRR - Churn - Contraction) / Starting MRR) × 100 | Testing core retention independent of upsells |
Logo Churn vs. Revenue Churn | Customer vs. dollar attrition | Lost Customers / Total vs. Lost MRR / Total MRR | Understanding whether you lose small or large accounts |
Daily Active Users (DAU) | Daily product engagement | Unique Users per Day | Tracking short-cycle product health |
Monthly Active Users (MAU) | Monthly product reach | Unique Users per Month | Measuring total engaged user base |
DAU/MAU Ratio | Usage frequency | (DAU / MAU) × 100 | Assessing habit formation and stickiness |
Activation Rate | New user onboarding success | (Users Reaching Key Action / Total Sign-Ups) × 100 | Diagnosing early-funnel drop-off |
Feature Adoption Rate | Specific capability usage | (Users Using Feature / Total Active Users) × 100 | Validating roadmap bets |
Trial-to-Paid Conversion | Monetization funnel performance | (Paid Conversions / Trial Sign-Ups) × 100 | Measuring sales motion or self-serve efficiency |
Expansion MRR Rate | Upsell and cross-sell velocity | (Expansion MRR / Starting MRR) × 100 | Quantifying account growth motion |
Product Qualified Leads (PQL) | Usage-based sales signals | Users Meeting Engagement Threshold | Focusing on product-led outreach |
Time to First Value | Onboarding friction | Days from Sign-Up to Activation Event | Identifying setup bottlenecks |
Viral Coefficient | Organic user acquisition | (Invitations Sent × Conversion Rate) per User | Testing network effects |
Revenue Per Employee | Operational leverage | ARR / Headcount | Benchmarking burn and scaling efficiency |
Magic Number | Sales and marketing ROI | Net New ARR / Prior Quarter S&M Spend | Deciding whether to accelerate spend |
NRR above 110% signals your existing customer base grows revenue without new logo acquisition. A Magic Number above 0.75 supports increased go-to-market investment.
Retail and E-commerce KPIs
Retail metrics track store economics, digital funnel health, and where revenue leaks across channels.
KPI | What It Measures | Formula | When to Use |
|---|---|---|---|
Sales Per Square Foot | Store space productivity | Total Sales / Retail Square Footage | Store format decisions |
Conversion Rate | Visitor-to-buyer success | (Transactions / Total Visitors) × 100 | Layout optimization |
Average Order Value (AOV) | Transaction size | Total Revenue / Number of Orders | Pricing and bundling strategy |
Cart Abandonment Rate | Checkout drop-off | (Carts Created - Purchases) / Carts Created × 100 | Checkout friction diagnosis |
Customer Acquisition Cost (CAC) | Cost per new buyer | Total Marketing Spend / New Customers | Channel profitability |
Return Rate | Product dissatisfaction | (Items Returned / Items Sold) × 100 | Quality and sizing issues |
Inventory Turnover | Stock rotation speed | Cost of Goods Sold / Average Inventory | Working capital efficiency |
Foot Traffic | Physical visitor volume | Store Visitors per Time Period | Location performance and staffing |
Same-Store Sales Growth | Organic revenue growth | ((Current Sales - Prior Sales) / Prior Sales) × 100 for stores open 12+ months | Growth quality without expansion |
Basket Size | Items per transaction | Total Units Sold / Number of Transactions | Cross-sell effectiveness |
Sell-Through Rate | Inventory sold | (Units Sold / Units Received) × 100 | Buying accuracy |
Markdown Percentage | Discount depth | (Discount Amount / Original Price) × 100 | Margin erosion tracking |
Browse-to-Buy Rate | Product page conversion | (Purchasers / Product Page Viewers) × 100 | Page effectiveness |
Repeat Purchase Rate | Customer retention | (Customers with 2+ Orders / Total Customers) × 100 | Lifetime value drivers |
Cart abandonment above 70% points to checkout friction or surprise costs. Same-store sales growth isolates performance from new locations, revealing whether existing stores stay healthy.
How to Select the Right KPIs for Your Organization
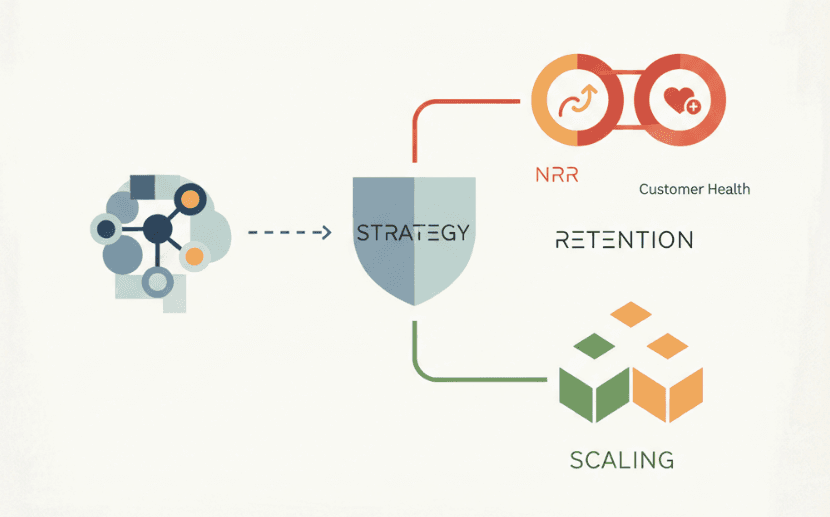
Start with your strategic objectives, not industry benchmarks. If you're focused on retention, track NRR and customer health scores. If you're scaling sales, monitor pipeline velocity and rep quota attainment.
Limit yourself to 7-10 critical indicators. More than that dilutes focus and creates noise. Every KPI you track should inform a decision you're ready to act on.
The Balanced Scorecard structures KPI selection across four perspectives: financial, customer, internal process, and learning and growth. This prevents over-indexing on revenue metrics while operations or retention decay.
Balance leading and lagging indicators. Lagging KPIs confirm outcomes like closed revenue and churn. Leading KPIs predict them through pipeline coverage and product engagement. You need both to steer, instead of just report history.
Test measurability before committing. Can you pull the data monthly without manual work? If a metric requires three systems and two analysts to calculate, it won't get tracked consistently.
Choose indicators you control. A sales team can influence conversion rates and cycle length. They can't directly control market conditions. Assign KPIs to the people who can move them.
Final thoughts on measuring what matters
Tracking the right key performance indicators turns data into decisions instead of reports that sit in slides. Choose 7-10 metrics tied to objectives you're ready to act on, balance forward-looking signals with backward-looking confirmation, and make sure the people responsible can actually move the numbers. Your KPI set should change as your priorities do.
FAQ
How do I choose which KPIs to track when I'm just starting out?
Start with 7-10 indicators tied directly to your current strategic goal, if you're focused on growth, track pipeline velocity and conversion rates; if retention is the priority, monitor NRR and customer health scores. Pick metrics you can measure monthly without manual work and that your team can actually influence.
What's the difference between leading and lagging KPIs?
Leading indicators predict future performance before outcomes materialize (pipeline coverage, trial sign-ups, product engagement), while lagging indicators confirm what already happened (closed revenue, churn rate, quarterly profit). You need both, lagging KPIs tell you where you landed, leading KPIs show where you're headed.
When should I stop tracking a KPI?
Drop a KPI when it no longer informs a decision you're ready to act on, when the strategic priority changes, or when pulling the data requires more effort than the insight is worth. If a metric takes three systems and two analysts to calculate each month, it won't get tracked consistently and should be replaced.
Can I use the same KPIs across different departments?
Some KPIs like revenue growth or customer retention span departments, but most should be department-specific, sales teams track win rate and cycle length, operations monitors throughput and defect rate, customer success watches health scores and renewal rate. Shared company-level KPIs work for alignment; functional KPIs drive execution.
How often should I review and update my KPIs?
Review KPI relevance quarterly and refresh your set annually or when strategic priorities shift. If you're scaling from product-market fit to growth, your KPIs should evolve from activation rate and feature adoption to pipeline velocity and sales efficiency, what matters at 10 customers differs from what matters at 1,000.