Productivity
Best Real-Time Collaborative Analytics Platforms Compared in November 2025
Compare real-time collaborative analytics platforms in December 2025: Mode, ThoughtSpot, Sigma, and Index. See which tools let teams edit dashboards together live.

If you've ever waited hours for a data team ticket just to tweak a filter or add one more chart, you already know why collaborative analytics matters. The best tools let your whole team query data together, see live updates, and iterate on dashboards without leaving the interface. We tested the top shared analytics workspace platforms to see which ones make real-time collaboration smooth and which ones still feel like glorified screenshot generators.
TLDR:
Real-time collaborative analytics lets teams edit dashboards simultaneously with live updates
Mode requires SQL skills, ThoughtSpot needs weeks of setup, Sigma works like Excel on warehouses
Index connects to your data in minutes and answers plain-English questions without modeling
Teams see each other's cursors and changes instantly, turning analysis into shared work
Index lets you ask questions in natural language, use visual tools, or write SQL in one workspace
What is Real-Time Collaborative Analytics?
Real-time collaborative analytics lets multiple team members investigate their data, build dashboards, and refine reports simultaneously with live updates visible to everyone. Changes appear instantly, and everyone works from the same source of truth instead of emailing static spreadsheets.
This capability matters because data decisions increasingly need cross-functional input. When a product manager, data analyst, and finance lead need to align on revenue forecasts, waiting for sequential handoffs kills momentum. 61% of remote teams say lack of real-time collaboration slows down project execution, and analytics workflows are no exception.
Teams now expect the same fluid collaboration in their BI tools that they already have in Figma, Notion, or Slack. When someone can jump into a dashboard, filter data, add a chart, and tag a teammate without leaving the interface, analysis becomes a conversation instead of a ticket queue.
What is Mode Analytics?
Mode is a SQL-first analytics workspace for data teams who work in code. Users write SQL, Python, or R queries in notebooks, then convert those queries into visual reports.
The tool focuses on reproducibility and version control. Analysts build reusable queries that teammates can fork and modify, creating a shared library of analysis logic. Reports update when underlying code changes, keeping data current without manual requests.
Mode fits teams with SQL practitioners who need collaborative notebooks and a reporting layer. Non-technical users depend on analysts to build queries, since there's no natural language interface.
What is ThoughtSpot?
ThoughtSpot uses a search-first approach where users type questions like "revenue by region last quarter" instead of building dashboards. The system maps keywords to your data schema and returns visualizations.
This works when data is well-modeled and indexed. ThoughtSpot requires upfront data modeling so the system can match business terms to database columns. Once configured, business users can ask questions without SQL.
Implementation takes weeks to months as data teams configure the search index, define synonyms, and set access rules. ThoughtSpot targets larger organizations willing to invest in that setup for self-service analytics.
What is Sigma Computing?
Sigma Computing gives business users a spreadsheet interface on top of warehouse data. Instead of chart builders, you manipulate data using formulas, pivots, and cell references. Queries run directly against your Snowflake or BigQuery warehouse in real time.
The spreadsheet model works well for financial analysts and operators who already think in Excel. They can build calculations, reference cells across sheets, and construct tables without learning a new interface. Sigma translates spreadsheet operations into SQL behind the scenes.
Collaboration happens inside shared workbooks where teammates see each other's cursors and edits live.
What is Index?
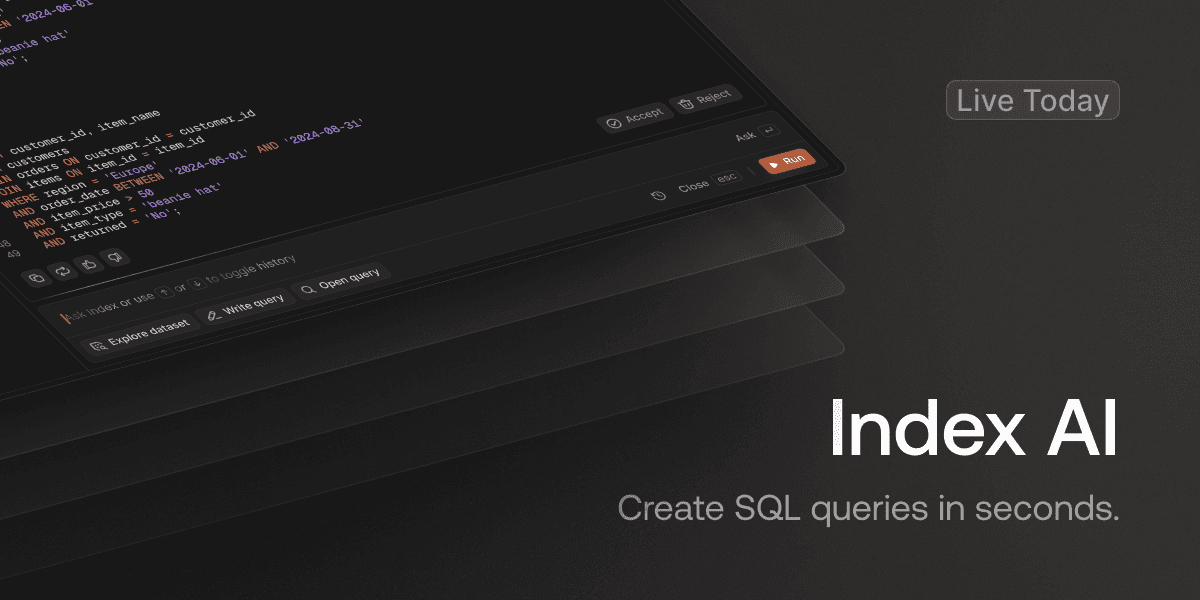
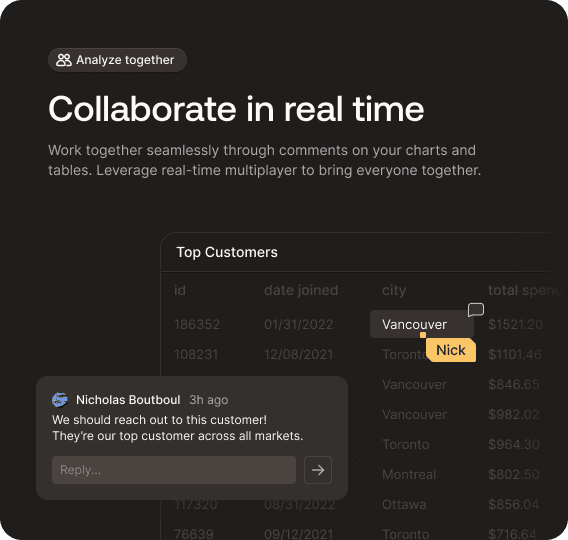
Index is an AI-powered business intelligence tool that lets teams ask questions in plain English and get back instant charts, tables, and metrics. The product layers natural language queries, visual exploration, SQL editing, and real-time multiplayer collaboration into one interface.
Setup takes minutes. Connect sources like Snowflake, BigQuery, Postgres, Stripe, or Salesforce, and Index maps your schema automatically. Pre-built metrics and templates for SaaS KPIs like retention cohorts and revenue tracking let teams start analyzing immediately.
Multiple users work in the same report at once with live cursor presence, turning dashboard creation into a collaborative process instead of a ticket queue.
Natural Language Query Capabilities
Mode added AI capabilities but relies on SQL notebooks. Teams share queries and results, yet the natural language layer remains light. Business users who can't write SQL face friction because Mode doesn't convert conversational questions into working queries reliably.
ThoughtSpot uses keyword search to match terms against your data schema. Typing "revenue by region" works when field names are consistent and your semantic layer is well-maintained. Teams with inconsistent naming conventions or exploratory workflows often guess which keywords will return results, since matching depends on pre-configured indexes instead of interpreting intent.
Sigma uses spreadsheet formulas and pivots instead of natural language. Excel users who understand the schema can build queries quickly, but there's no conversational layer for analyzing unfamiliar datasets.
Index AI parses plain-English questions and generates charts automatically. Ask "what's our retention by cohort this quarter" without knowing column names, writing formulas, or memorizing the schema.
This removes the translation layer between business question and technical query, which aims to solve the fact that only 60% of organizations despite data democratization being a top priority for 2025.
Real-Time Collaboration Features
Mode supports shared notebooks and reports, but the experience is asynchronous. Multiple users can view and comment on saved reports, yet simultaneous query editing creates version conflicts. This workflow fits teams where analysts create queries and distribute static results.
ThoughtSpot allows users to share searches and pinboards with commenting and embedding. It lacks live multiplayer presence where you see cursors and edits as they happen. The collaboration model is share-and-review instead of co-edit, which works for consuming finished dashboards but limits iterative refinement sessions with stakeholders.
Sigma includes shared workbooks and commenting, though real-time synchronization is inconsistent. Users working in the same workbook may experience lag or need manual refreshes when multiple people edit simultaneously.
Index was built with real-time multiplayer collaboration from the start. Multiple team members can query the data and build reports simultaneously with live updates and presence indicators. You see where teammates are working, changes appear instantly, and there are no version conflicts or sync delays. Collaboration works across natural language queries, visual exploration, and SQL editing.
Data Source Integration and Setup Speed
Mode connects to databases through SQL but demands technical expertise to configure connections and write data models. Initial setup requires SQL knowledge and time for query development.
ThoughtSpot requires building a semantic layer before users can search data. This modeling phase can span weeks or months for complex datasets and needs ongoing maintenance when schemas change.
Sigma connects to cloud warehouses like Snowflake and BigQuery quickly, letting users analyze data in spreadsheet format. Integration is limited primarily to cloud warehouses instead of diverse sources.
Index connects to cloud warehouses, relational databases, and SaaS apps like Stripe, Salesforce, and PostHog in minutes. No semantic layer or upfront modeling required.
Application | Natural Language Capability | Real-Time Collaboration | Setup Time | Best For | Key Limitation |
|---|---|---|---|---|---|
Mode | Light AI layer over SQL notebooks; doesn't reliably convert conversational questions | Asynchronous sharing with comments; simultaneous editing creates version conflicts | Requires SQL expertise and time for query development | SQL-heavy data teams who think in notebooks and need reproducible analysis | Business users who can't write SQL face substantial friction |
ThoughtSpot | Keyword search matches terms against pre-configured indexes; requires consistent naming | Share-and-review model with commenting; lacks live multiplayer presence and cursor tracking | Weeks to months for semantic layer configuration and ongoing maintenance | Large enterprises willing to invest in semantic layer governance for self-service analytics | Exploratory searches slow down when semantic layer hasn't been optimized for new data combinations |
Sigma Computing | No natural language; uses spreadsheet formulas and pivots instead | Shared workbooks with commenting; real-time synchronization is inconsistent with lag and manual refresh needs | Quick connection to cloud warehouses; limited to warehouse-native sources | Financial analysts and operators who already think in Excel and work with cloud warehouses | Non-spreadsheet users struggle to collaborate or analyze data conversationally |
Index | AI parses plain-English questions and generates charts automatically without knowing schema | Built-in multiplayer with live cursor presence, instant updates, and no version conflicts | Minutes to connect sources with automatic schema mapping and no upfront modeling | Cross-functional teams needing real-time collaboration across technical and non-technical users | None mentioned in comparison |
Performance and User Experience
Mode offers a notebook-style interface that data scientists recognize, but query speed depends on your warehouse. The code-first design works well for SQL-fluent analysts but limits access for business users who need answers without writing queries.
ThoughtSpot's search interface handles repetitive queries quickly, though performance depends on pre-built indexes. Exploratory searches on new data combinations slow down when the semantic layer hasn't been optimized for those patterns.
Sigma reduces the learning curve with spreadsheet-like interactions. Query speed stays fast with indexed warehouse tables, though very large datasets or multi-table joins can create bottlenecks when the spreadsheet form factor meets warehouse-scale operations.
Index delivers near-instant query results and fast dashboard loads, with built-in observability to monitor query performance.
Users switch between natural language, visual explorer, or SQL for any task, letting technical and non-technical team members work in the mode that fits their workflow.
Why Index is the Better Choice
Mode fits SQL-heavy data teams who think in notebooks. ThoughtSpot works for enterprises willing to invest in semantic layer governance. Sigma suits spreadsheet-focused analysts with warehouse-native operations.
Index delivers real-time collaborative analytics without the usual trade-offs. Changes appear instantly as teammates edit, natural language queries work without pre-configured indexes, and both technical and non-technical users work in one shared workspace.
Setup takes minutes. Connect your sources and the team can start asking questions immediately. No semantic layers or upfront modeling required. Everyone works in their preferred mode: natural language, visual explorer, or SQL. The entire team can collaborate on live data analysis, turning analytics into a shared conversation.
Final thoughts on multiplayer dashboards and team data work
Your analytics tool should support how teams actually work: multiple people analyzing data together, asking questions in different ways, and seeing changes instantly. Multiplayer dashboards turn analysis into a shared process instead of a solo task that gets passed around. Index built that real-time collaboration from day one, so your whole team can work on the same data without version conflicts or access friction.
FAQ
What does real-time collaboration mean in a BI tool?
Real-time collaboration means multiple team members can work in the same dashboard simultaneously, seeing each other's edits and cursor positions instantly similar to Google Docs but for data analysis. Changes appear live without version conflicts or manual refreshes, turning analytics into a shared conversation instead of sequential handoffs.
How long does it take to set up a collaborative analytics tool?
Setup time varies widely: ThoughtSpot requires weeks to months for semantic layer configuration, Mode needs SQL expertise and data modeling time, while tools like Index connect to your data sources in minutes with automatic schema mapping and no upfront modeling required.
Can non-technical users query data without learning SQL?
It depends on the tool: Mode requires SQL knowledge, Sigma uses spreadsheet formulas (which still need schema understanding), ThoughtSpot works through keyword search if your data is well-modeled, and Index interprets plain-English questions without requiring users to know column names or write queries.
What's the difference between search-based and AI-powered analytics?
Search-based tools like ThoughtSpot match your keywords against pre-configured indexes and require upfront semantic layer setup, while AI-powered tools like Index interpret intent from natural language questions without needing pre-built mappings making exploratory analysis on unfamiliar datasets faster.
When should I choose a spreadsheet-style BI tool over other approaches?
Choose spreadsheet-style tools like Sigma if your team already thinks in Excel formulas and pivots, works primarily with cloud warehouses, and prefers cell-based calculations over chart builders but expect limitations when non-spreadsheet users need to collaborate or dissect data conversationally.