Productivity
Best No-Code Analytics Platforms for Non-Technical Teams (December 2025)
Compare the best no-code analytics tools for non-technical teams in December 2025. SQL-free BI platforms with natural language queries, drag-and-drop dashboards, and instant setup.

Most BI tools say they're built for everyone, but then you open them up and realize you still need to know SQL or spend weeks on setup. SQL-free analytics platforms are designed to remove that barrier, letting non-technical teams query data and build reports on their own. We looked at which ones actually follow through on making data accessible to everyone.
TLDR:
No-code analytics tools let non-technical teams query data through visual interfaces and natural language instead of SQL
Index delivers instant answers by converting plain English questions into charts in minutes, not weeks
Legacy platforms like Tableau and Looker require heavy upfront modeling or proprietary syntax
Index combines AI-powered queries, drag-and-drop dashboards, and pre-built SaaS metrics for immediate self-service
Index offers transparent per-seat pricing and connects to warehouses plus SaaS apps without engineering dependencies
What are no-code analytics tools?
No-code analytics tools let teams query data without technical skills. Unlike legacy systems requiring code, these solutions support business user BI through visual interfaces. This replaces filing tickets with independent, non-technical data analysis. By handling query logic in the background, SQL-free analytics and drag-and-drop dashboards let users visualize trends instantly while data experts focus on infrastructure.
How we ranked no-code analytics tools
Methodology
We focused on no-code analytics tools that allow non-technical data analysis without engineering support.
Our evaluation criteria for business user BI include:
Accessibility: Interfaces allowing SQL-free analytics via natural language.
Speed: Connecting data sources immediately without heavy semantic modeling.
Usability: True drag-and-drop dashboards instead of proprietary scripting.
Collaboration: Features for real-time sharing and multiplayer editing.
Cost: Transparent pricing models over opaque contracts.
Best Overall No-Code Analytics Tool: Index
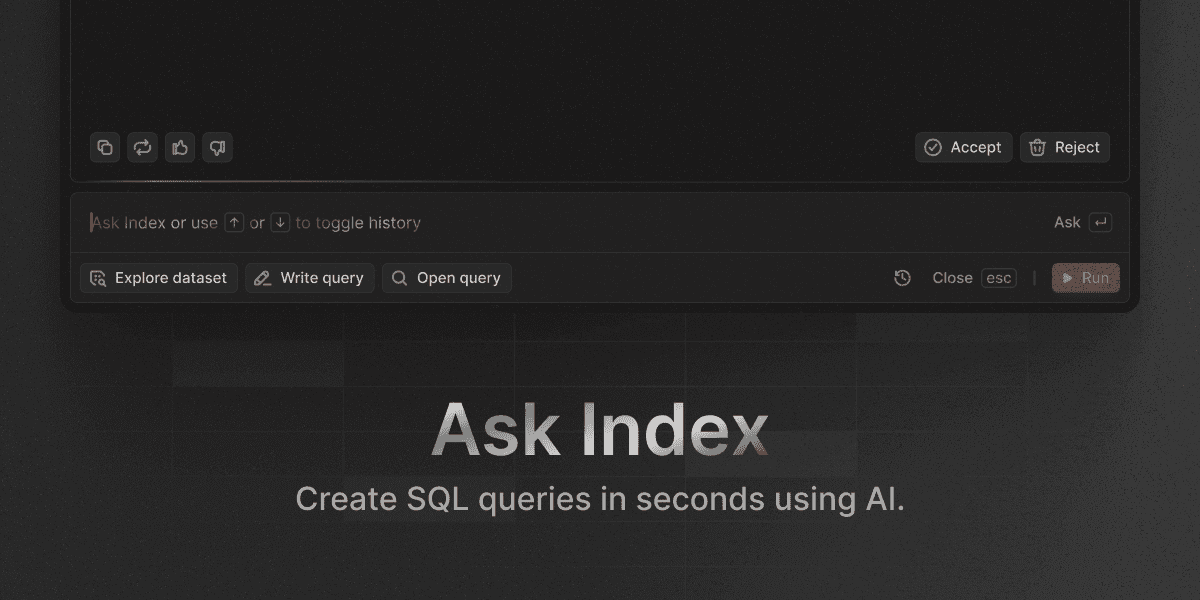
Index
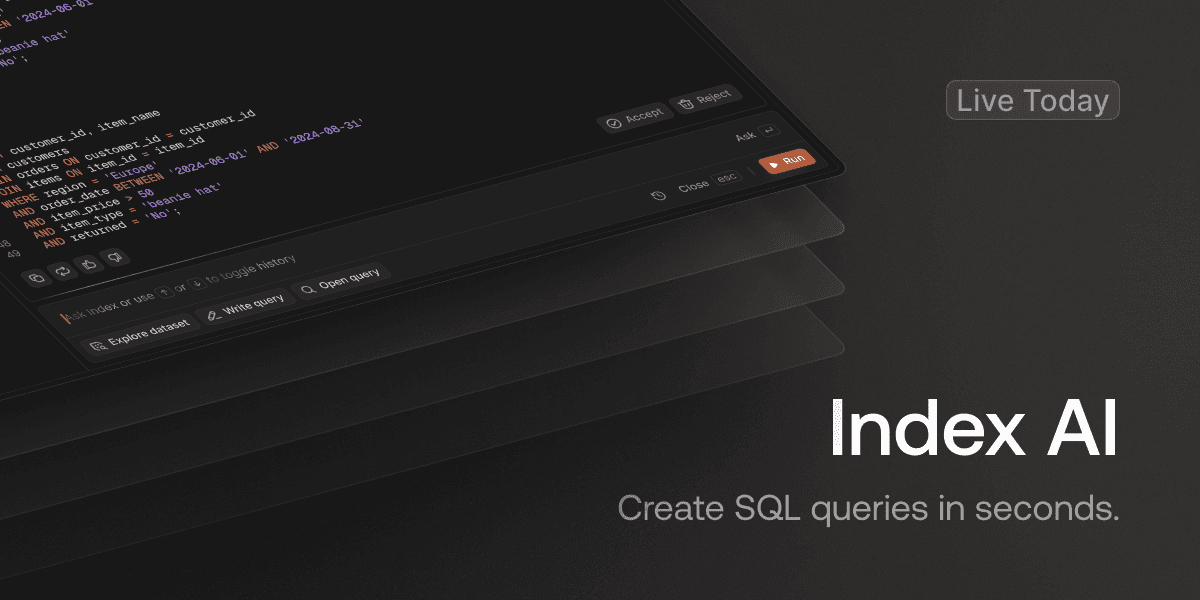
Index delivers no-code analytics for teams needing instant answers. You ask questions in plain English and get charts immediately, removing the report backlog. This workflow supports business user BI without requiring SQL skills.
Natural language queries - AI converts text questions into visualizations automatically.
Visual explorer - Point-and-click interface allows for flexible querying alongside a SQL editor.
Pre-built metrics - Default SaaS templates eliminate the blank slate problem.
Real-time collaboration - Multiplayer functionality lets teams edit dashboards simultaneously.
Broad connectivity - Connects with warehouses like Snowflake and apps like Salesforce.
Customer-facing dashboards - White-label options allow for external sharing.
Fast setup - Implementation takes minutes.
Index provides a direct path from question to insight by combining AI chat with drag-and-drop dashboards.
Metabase
Metabase provides open-source software for basic no-code analytics. Its visual builder sits atop databases, allowing teams to generate charts without writing SQL.
Drag-and-drop interface for non-technical users
Self-hosted and cloud deployment options
Basic embedding capabilities
Teams with engineering resources for server maintenance benefit most. However, it lacks AI-powered querying, meaning users cannot ask questions in plain text like they do with Index.
ThoughtSpot
ThoughtSpot
ThoughtSpot focuses on search-driven analysis. It replaces standard dashboards with a search bar where users type keyword queries to retrieve charts. This approach targets enterprises needing strict governance over massive datasets and aims to let business users answer their own questions without waiting for analysts.
Keyword-based search bar for generating reports
SpotIQ for automated outlier detection
Direct query capabilities for cloud data warehouses
Granular security controls for row-level access
While strong for large organizations, ThoughtSpot demands heavy upfront data modeling. Engineering teams must define worksheets and relationships before business users can search anything. The interface relies on tokenized keywords instead of conversational language, often forcing users to learn specific syntax rules to get accurate results. Index differs by interpreting natural language questions immediately and removing the requirement for extensive pre-modeling, allowing teams to ship answers faster without a dedicated engineering sprint.
Tableau
Tableau provides extensive charting capabilities through desktop software.
Advanced visualization library
Desktop application for authoring
Large user community
Salesforce integration
It targets analysts requiring pixel-perfect reports. This depth creates a steep curve for non-technical users. Tableau serves specialists designing very specific visuals, whereas Index supports business teams needing immediate answers.
Looker
Looker depends on LookML to define a semantic layer. This creates strong governance but restricts access to those who write code, forcing business teams to wait on engineering for updates.
LookML syntax defines rigid data models and metrics.
Deep integrations favor teams on Google Cloud stacks.
Embedded analytics features suit product engineering use cases.
This setup creates a bottleneck. Index solves this by interpreting natural language, allowing teams to visualize data without learning a proprietary modeling language.
Microsoft Power BI
Power BI fits enterprises deeply committed to Microsoft 365. Most teams adopt it for the bundled licensing cost.
Native Office integration
DAX formula language
Power Query data prep
The learning curve limits true self-service. Modeling requires DAX expertise and desktop software. Index offers an alternative by running entirely in the browser and replacing complex syntax with natural language queries.
Mode Analytics
Mode Analytics
Mode merges SQL notebooks with business intelligence, strictly targeting analysts who prefer code.
SQL editor with version control
Python and R integration
Collaborative notebook environment
This structure forces a dependency on technical staff. Since Mode lacks natural language querying or a true visual builder, business users cannot self-serve. Every question requires an analyst to write a query first.
Sigma Computing
Sigma Computing
Sigma applies a spreadsheet interface to cloud data warehouses, allowing teams to manipulate data using standard formulas that compile into SQL.
Spreadsheet UI for cloud data
Live collaboration
Scenario planning tables
It suits heavy Excel users but strictly requires a warehouse setup. Unlike Sigma’s formula-based approach, Index allows users to query data using plain text and connects directly to business apps.
Preset
Preset
Preset offers managed hosting for Apache Superset, removing DevOps overhead. However, creating dashboards typically demands SQL fluency. This technical requirement creates friction for business users seeking a no-code environment.
Managed Superset hosting
SQL-based chart creation
Open-source foundation
Lacking AI features for natural language querying, Preset mainly serves data engineers. Index differs by abstracting the SQL layer completely, allowing non-technical staff to build analysis using plain English.
Domo
No-code analytics permits non-technical teams to query databases and generate reports without learning SQL. While legacy BI relies on data engineers for updates, business user BI tools use drag-and-drop dashboards for immediate analysis. This SQL-free analytics approach allows operators to build their own metrics, removing the bottleneck of technical dependencies.
Omni
Omni
Omni couples a semantic layer with BI tools. Teams define metrics via SQL and dbt, standardizing logic before visualization. This approach fits organizations where engineers want to manage the data pipeline while giving end-users rigid exploration paths.
Native dbt integration aligns metric definitions with upstream logic
Fast pivot tables support Excel-style data manipulation
Requires SQL knowledge for initial setup and modeling
Holistics
Holistics
Holistics manages BI through code, requiring SQL and YAML to define metrics. This connects analytics with development workflows via Git.
Git-based version control
Code-based metric definitions
Reporting layer
It targets engineers instead of those seeking no-code analytics. The coding requirement limits access for non-technical teams. Users cannot query data with natural language here. Index supports business user BI by allowing questions without code maintenance.
Hex
Hex combines SQL, Python, and R into a collaborative notebook interface. It targets data scientists who need to perform complex analysis and turn scripts into shareable web apps.
Polyglot notebooks (SQL, Python, R)
Interactive data app publishing
Built-in version control
Since Hex relies on code-heavy workflows, it demands technical fluency. It suits data engineers building tools for others instead of business users seeking independence.
Feature Comparison Table of No-Code Analytics Tools
Comparison Matrix
Choosing the right software requires balancing ease of use with raw technical power. This breakdown compares top contenders for business user BI, focusing on SQL-free analytics capabilities and implementation speed.
Feature | Index | Metabase | ThoughtSpot | Tableau | Looker | Power BI |
|---|---|---|---|---|---|---|
Natural Language | Advanced AI | None | Keyword Search | Limited | None | Basic Q&A |
Visual Builder | Drag-and-Drop | Basic GUI | Search-based | Desktop GUI | LookML Required | Desktop GUI |
Pre-built Metrics | Yes (SaaS Templates) | No | No | No | No | No |
Setup Time | Minutes | Hours | Weeks | Months | Months | Weeks |
Integrations | Warehouse + SaaS | Database Focus | Warehouse Focus | Extensive | Warehouse Only | Microsoft Focus |
Collaboration | Multiplayer | Async | Async | Async | Git-based | Async |
External Dashboards | Yes (White-label) | Basic | Yes | Yes | Yes | Yes |
Pricing | Transparent | Transparent | Contact Sales | Complex | Contact Sales | Transparent |
Legacy tools often demand weeks of data modeling before teams visualize a single metric. Index connects in minutes, permitting non-technical teams to answer ad hoc questions immediately without engineering dependencies.
Why Index is the best no-code analytics tool for non-technical teams
Legacy tools hurt BI adoption rates by demanding technical skills. Index removes this barrier. You type questions in plain English, and our AI generates dashboards.
Current usage trends demand agility. We cut setup delays so you analyze data without engineering bottlenecks. Reflecting the growing no-code AI market, we focus on accessibility. Simple per-seat pricing helps teams move from guessing to validating.
Final thoughts on selecting analytics tools for non-technical users
Your team already knows what questions to ask. Drag-and-drop dashboards and natural language queries just remove the friction between curiosity and insight. Index connects to your warehouse or SaaS apps in minutes, so you can start analyzing without waiting on engineering sprints. Type a question in plain English and see what you find.
FAQ
How do I get started with no-code analytics if my team has never used BI tools before?
Connect your data source (warehouse or SaaS app), then ask questions in plain English. Tools like Index generate charts automatically without requiring SQL knowledge or data modeling. Most platforms offer pre-built templates for common metrics like retention or revenue, so you can start analyzing immediately instead of building from scratch.
What's the main difference between natural language querying and keyword search in analytics tools?
Natural language querying interprets full conversational questions ("What's our churn rate by cohort this quarter?") and generates appropriate visualizations, while keyword search requires specific tokens or syntax that users must learn. The former removes the learning curve, letting business users get answers without memorizing command structures.
When should I choose a no-code tool over traditional BI platforms like Tableau or Looker?
If your team spends more than a few days waiting for analysts to answer recurring questions, or if non-technical staff need self-service access without learning SQL or proprietary languages like LookML, a no-code tool cuts that dependency. Traditional tools suit teams with dedicated BI developers building complex, pixel-perfect reports.
Can I share dashboards with customers or external stakeholders using no-code analytics?
Yes. Platforms like Index offer white-labeled, embeddable dashboards with custom domains and per-customer data isolation, letting you deliver live analytics to clients without engineering effort. Not all no-code tools include this capability out of the box, so verify external sharing features if client-facing reports are a priority.