Productivity
Hex Reviews, Pricing, and Alternatives (January 2026)
Hex reviews reveal $75/user pricing and performance issues with 70+ cell notebooks. Compare alternatives like Index that remove coding barriers for non-technical teams in January 2026.

You're researching Hex reviews because someone on your team suggested it, or you're tired of your current BI setup. Hex gets praised for its notebook interface and polyglot support, but the reviews also mention performance lag with complex projects and a steep learning curve for non-coders. If your data team is small and your stakeholders need answers now, that technical barrier becomes a real problem. This guide covers what actual users say about Hex, where it shines, where it struggles, and which alternatives remove the coding dependency so your whole org can self-serve.
TLDR:
Hex is a collaborative notebook for data scientists mixing SQL, Python, and R in one flow
Pricing starts at $75/user monthly, creating gatekeeping instead of data democratization
Performance degrades a lot in notebooks exceeding 70+ cells with lag and search failures
Index removes the coding barrier with plain-English queries that generate charts instantly
Index delivers answers in minutes versus weeks of Hex notebook configuration and setup time
What is Hex and How Does it Work?
Hex is a collaborative notebook. It sits between a raw code editor and a dashboard, combining SQL, Python, and R into a single logic flow. It avoids rigid drag-and-drop interfaces in favor of a workspace for exploration and transformation. It is essentially Jupyter notebooks with a superior UI and built-in hosting [1].
How It Works
The system uses a modular, cell-based structure. You pull data with a SQL cell, pipe it into a Python cell for transformation (using pandas or polars), and finish with a dashboard visualization.
Key mechanics include:
Polyglot Workflow: Mix multiple languages in one analysis.
Reactive Compute: Updates to upstream variables trigger downstream chart changes immediately.
App Publishing: Hide backend code to publish interactive "Data Apps" for stakeholders.
Good for: data scientists, analytics engineers, and technical analysts who are comfortable with SQL and Python and want a better-UX alternative to traditional notebooks plus built-in sharing.
Limitation: non-technical teams face a steep learning curve; it still requires coding, and it can struggle as a primary BI layer for very large, enterprise-wide workloads compared with heavier-duty analytics platforms.
Bottom line: Hex is a powerful builder tool for technical users who need exploratory, code-first analytics and easy app publishing, but it is not a self-service BI solution for broad, non-technical audiences.
Why Consider Hex Alternatives?
Hex is purpose-built for data scientists. If your team writes Python and SQL, the version control and environment make sense. But for everyone else? It creates friction.
The Cost Barrier
The pricing model actively discourages broad access. You are looking at $75 per user monthly. That matches the cost of a Tableau Creator license. Instead of democratizing data, you end up gatekeeping it. Companies are forced to restrict licenses to a handful of analysts instead of giving access to the wider org.
Performance Drag
Notebooks are excellent until they get heavy. The compute struggles to keep up with complexity. Performance drops a lot in projects exceeding 70+ cells. Scrolling lags. Search functions fail. When a stakeholder needs a fast answer, waiting for a massive notebook to recompute kills momentum.
The Technical Bottleneck
Hex demands expertise. You start with a blank screen, not a dashboard. This creates a hard dependency on technical staff. Sales and marketing cannot build their own views. They must wait for an engineer to code the app. If the goal is instant answers for non-coders, this architecture works against you.
Best Hex Alternatives in January 2026
Notebooks are great for builders. They are terrible for consumers. If your goal is stopping the endless backlog of "quick questions" from piling up in Slack, you need a different architecture. You need a tool that lets stakeholders answer their own questions. Here is the ranked list of Hex alternatives that actually solve the bottleneck.
Index (Best Overall Alternative)
Index is a text-to-SQL BI tool. It changes the fundamental workflow of analytics. Instead of writing SQL or Python cells to get an answer, you ask questions in plain English. The system generates charts, tables, and metrics instantly.
Natural Language Query → Business users get insights via chat. No SQL required.
SaaS Metrics → Pre-built templates for churn, retention, and revenue accelerate setup.
Native Integrations → Connects to Snowflake, BigQuery, and HubSpot without heavy configuration.
Multiplayer Editing → Teams collaborate on dashboards in real time.
Good for: tech-driven companies (roughly 20–500 employees) with small data teams, where 1–5 analysts need to support a large organization without drowning in reporting tickets.
Limitation: best suited to modern cloud data stacks and teams willing to centralize BI in a new layer; very legacy-heavy environments may need additional integration and change management.
Bottom line: Index delivers notebook-level analytical depth without code, democratizing access so technical teams focus on infrastructure while business users get their own answers through natural language.
Omni
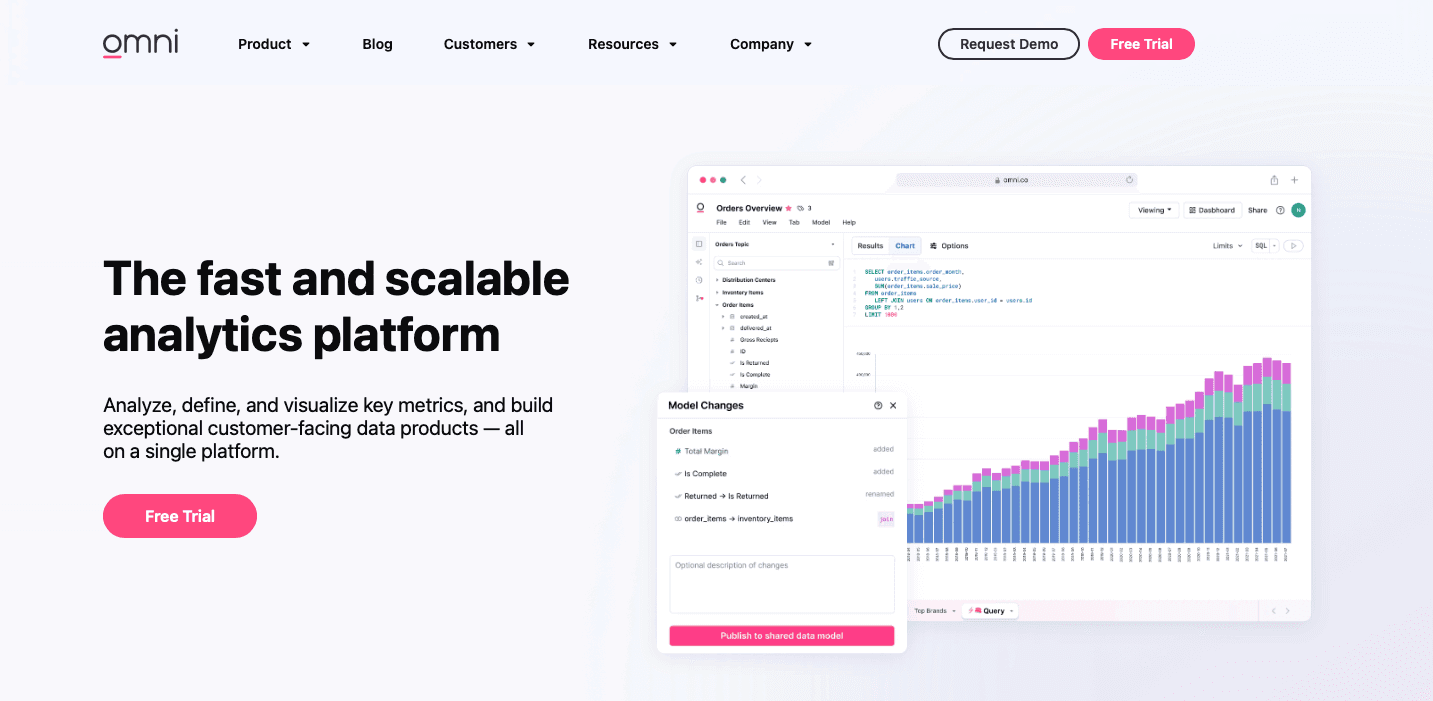
Omni bets on the semantic layer, combining an exploration UI with a rigid modeling layer that often integrates with dbt so metrics like “revenue” stay consistent across every chart.
What they offer
Semantic layer–first design that standardizes business definitions across reports.
Tight alignment with dbt-style modeling and governed metric definitions.
Good for: teams heavily invested in dbt and data modeling who want to push that governed logic directly into their BI layer so every dashboard uses the same metric definitions.
Limitation: it still demands high technical literacy; you need SQL and modeling expertise to build and maintain the semantic layer, and non-technical users cannot do much until that work is done, unlike Index’s more direct natural-language interface.
Bottom line: Omni is excellent for governance and consistent definitions, but index wins on accessibility by letting non-technical users use data without waiting on a fully modeled semantic layer.
Holistics
Holistics treats analytics as code, focsuing on version control, reviews, and CI/CD-style workflows so BI can be managed like software instead of ad-hoc reports.
What they offer
Code-first modeling and dashboard definitions with git-based workflows.
CI/CD-style deployment for analytics changes and environments.
Good for: engineering-led teams that view BI as infrastructure and want the same rigor (branching, reviews, releases) they apply to application code.
Limitation: setup is slow and demanding; everything must be defined in code before stakeholders see a single chart, which lengthens implementation timelines versus tools that connect and deliver value immediately.
Bottom line: Holistics is ideal for infrastructure purists who focus on code governance over speed, while index serves teams that need business answers today with minimal upfront modeling.
Tableau
Tableau is the legacy standard for BI, known for extremely flexible visualization capabilities where teams can build almost any chart if they invest the time and expertise.
What they offer
Rich, highly customizable visualizations with fine-grained layout control.
Mature ecosystem, governance features, and enterprise-grade deployment options.
Good for: organizations where pixel-perfect, presentation-quality reports matter more than speed, and where dedicated Tableau specialists are available.
Limitation: it is slow to iterate; building or changing a dashboard typically requires a specialist, and the lack of strong native text-to-SQL means most new questions become tickets instead of self-service queries.
Bottom line: Tableau wins on visualization flexibility and design control, while index wins on speed to insight and accessibility for non-technical users.
Mode Analytics

Mode is the closest direct competitor to the Hex-style architecture, combining SQL notebooks with Python and R so analysts can move from exploration to shareable reports in a single environment.
What they offer
SQL-first notebooks with support for Python and R.
Tight workflow from query to chart to published report in one workspace.
Good for: analysts who prefer to stay in a code editor, write SQL and scripts for most work, and only need to publish polished reports occasionally.
Limitation: it shares Hex’s core constraint: everything depends on code. If you do not know SQL, you cannot meaningfully use Mode, which effectively blocks most non-technical stakeholders from self-service.
Bottom line: Mode serves the analyst who writes queries; index serves the organization by letting non-technical teams get answers in natural language without touching code.
Feature Comparison: Hex vs Top Alternatives
Architecture decisions boil down to the end user. If the goal is raw engineering horsepower, notebook-centric tools win. If the goal is immediate answers for the business, the requirements look different.
Feature | Hex | Index | Omni | Holistics | Tableau | Mode Analytics |
|---|---|---|---|---|---|---|
AI Query | AI code gen | Yes | No | No | Limited | No |
No-Code Interface | Limited | Yes | No | No | Yes | No |
SQL Support | Yes | Yes | Yes | Yes | Yes | Yes |
Python/R Support | Yes | No | No | No | No | Yes |
Pre-Built Metrics | No | Yes | No | No | No | No |
Real-Time Analytics Collab | Yes | Yes | Yes | Yes | Limited | Yes |
Embedded Analytics | Yes | Yes | No | Limited | Yes | Limited |
Setup Time | Moderate | Minutes | Moderate | High | High | Moderate |
Why Index is the Best Hex Alternative
Hex enforces a rigid data hierarchy. The technical team builds. Everyone else views. If you cannot write Python, you are stuck in read-only mode waiting for updates.
The interface for data shouldn't be code. It should be English. Hex demands syntax proficiency to modify a chart or drill down. Index interprets natural language. This removes the dependency on the data team for ad-hoc requests. RevOps and Product teams get answers without filing a ticket or learning SQL.
Final Thoughts on Hex and Its Alternatives
Reading Hex reviews makes one thing clear: notebooks are great for data scientists but terrible for everyone else. If your analysts spend more time answering Slack questions than building infrastructure, the architecture is wrong. Index flips that by letting business users get their own answers while your technical team focuses on what matters.
FAQs
Why should you consider alternatives to Hex?
Hex requires SQL and Python expertise to function, creating a technical bottleneck where only data scientists can build analyses. If your goal is allowing non-technical teams to get answers without filing tickets, or if you're spending $75 per user monthly and still restricting access to a handful of analysts, an alternative built for broader self-service makes more sense.
What should you focus on when comparing data analytics platforms?
Focus on who will actually use the tool daily. If your team is mostly non-technical, focus on natural language query capabilities and pre-built metrics over notebook flexibility. Look at setup time (minutes vs. weeks), per-seat costs at scale, and whether stakeholders can answer their own questions or must wait for an analyst to write code.
When does it make sense to switch from a notebook-based tool?
Switch when your data team is drowning in ad-hoc requests from business users who can't build their own views. If you're managing projects with 70+ cells that lag during scrolling and recomputation, or if onboarding new users requires Python training instead of a 5-minute walkthrough, you've outgrown the notebook architecture for day-to-day business intelligence.
How long does it take to implement Index compared to Hex?
Index connects to your warehouse and starts answering questions in minutes, you skip the semantic layer build and Python environment setup that notebook tools require. Hex is a project that starts with a blank screen; Index is a utility that arrives with pre-configured SaaS metrics like retention cohorts and churn analysis ready to query immediately.
Can Index handle the same analytical depth as Hex without requiring code?
Yes, through natural language to SQL translation. Index generates the queries, charts, and tables that would normally require writing SQL or Python cells. You lose the ability to run custom machine learning models in R, but you gain the ability to let RevOps, Product, and Sales teams drill into data without waiting for an engineer to code the analysis.