Productivity
Best Customer-Facing Dashboard Solutions for B2B Companies (November 2025)
Compare the best customer-facing dashboard solutions for B2B companies in November 2025. White-label analytics, multi-tenancy, and embedded BI tools reviewed.

You're probably fielding the same questions from customers every week: How are we tracking? What's our usage looking like? Are we getting ROI? Instead of generating reports manually or giving customers access to your internal tools, you need customer-facing dashboards that surface their data automatically. The tricky part is that traditional BI tools like Tableau and Looker weren't designed for this use case, so you end up wrestling with complex embedding APIs, multi-tenant security, and white-labeling limitations.
TLDR:
Customer-facing dashboards embed analytics into your product so clients track their own ROI and usage metrics.
White-labeling, multi-tenancy, and custom domains are non-negotiables for B2B customer dashboards.
The embedded analytics market is expanding to $200B by 2033 as self-service data becomes table stakes.
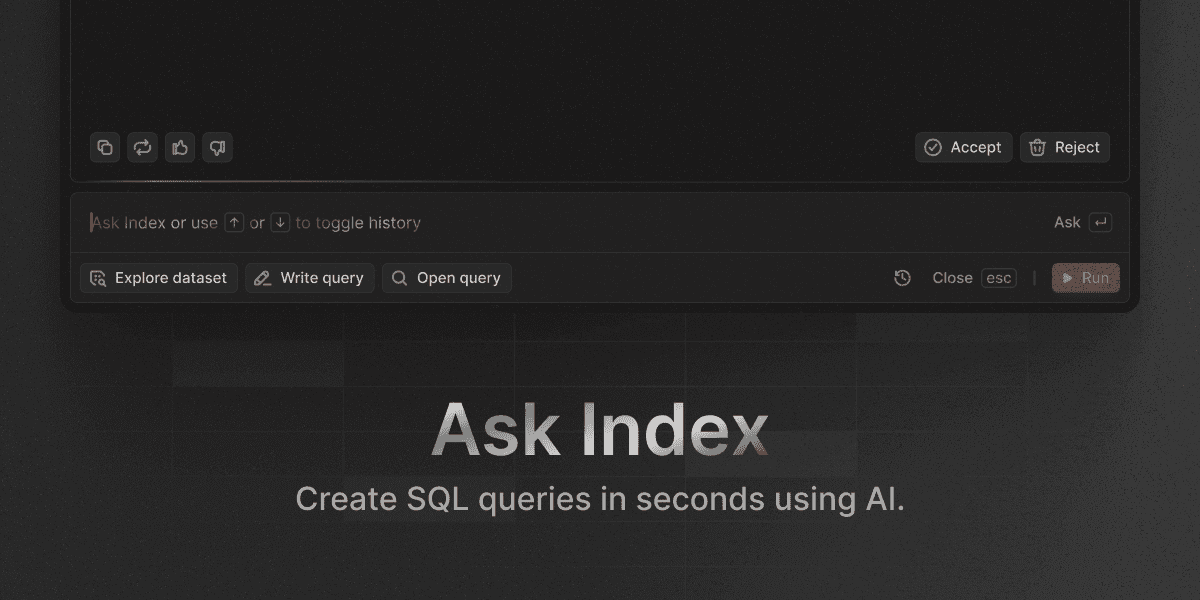
Index deploys white-labeled dashboards in minutes with AI-powered queries and automatic data isolation per customer.
What Are Customer-Facing Dashboards for B2B Companies?
Customer-facing dashboards are analytics interfaces that B2B companies embed directly into their products to serve end users through embedded analytics.
Instead of internal reporting tools that help your team make decisions, these dashboards surface data and insights to your customers.
The key difference is audience and purpose. Internal BI tools like Tableau or Looker help your employees analyze business performance. Customer-facing dashboards sit inside your product experience and show each client their own usage metrics, account health, or business outcomes.
Think of a payments processor showing transaction volume to merchants, or a SaaS app displaying feature adoption to account admins. These dashboards are white-labeled, multi-tenanted, and often embedded via iframe or API so customers see only their data with your branding.
Why B2B Companies Need Customer-Facing Analytics
Customer-facing analytics turn your product into a retention engine. When customers can track their own ROI inside your app, they're more likely to renew and less likely to churn. You're giving them proof of value at every login.
Support teams see immediate relief. Instead of fielding repetitive "how are we doing?" questions, you can point customers to their live dashboard. That frees up your team to handle higher-value conversations about strategy and optimization.
These dashboards also unlock new pricing levers. You can gate advanced analytics behind premium tiers or offer white-labeled reporting as an add-on. Companies already do this with feature access; now data becomes another monetization path.
The broader market agrees. The embedded analytics market is expanding to $200 billion by 2033, driven by rising demand for real-time insights. B2B buyers now expect self-service data as a standard feature, not a nice-to-have.
Key Requirements for B2B Customer Dashboards
When assessing customer dashboard solutions, start with these non-negotiables:
White-Labeling and Branding
Your customers should see your brand, not your vendor's. Look for full UI customization: logos, color schemes, fonts, and layouts.
The dashboard needs to feel like a native part of your product, not a bolted-on iframe with someone else's watermark in a multi-tenant environment.
Multi-Tenancy and Data Isolation
Each customer must see only their data, with zero risk of leakage. The solution should enforce row-level security at the database or query level. You need guaranteed isolation so Customer A never glimpses Customer B's metrics, even if your data lives in shared tables.
Custom Domains and SSL
Serving dashboards from analytics.yourcompany.com instead of vendor.io builds trust and credibility. Custom domain support with automatic SSL certificates keeps the experience easy and secure.
API and Embedding Options
You'll need flexible integration paths: iframe embeds, React components, or full REST APIs. The best solutions let you control authentication, pass user context programmatically, and trigger dashboard refreshes on demand from your own app logic.
Index
Index allows userrs to build customer-facing dashboards through a combination of natural language query and embedded analytics. Users can ask questions in plain English and get instant charts, then share those insights externally via white-labeled dashboards with custom domains and branding.
We built the embedding layer to isolate data per customer automatically, so each client sees only their metrics. You can deploy dashboards into your product or portal without writing custom visualization code or managing query infrastructure.
Setup takes minutes instead of weeks. Connect your data warehouse, build the dashboard once using our AI chat or visual builder, then embed it with an iframe or API call. The dashboard updates live as your data changes, with no manual refresh needed.

Tableau
Tableau offers embedded analytics through its External API and dedicated ISV licensing programs. The core strength is visualization quality: Tableau's chart library and interactive features are industry-leading, and many enterprises already run Tableau internally.
For customer-facing use cases, you'll work with Tableau Embedded Analytics, which lets you iframe dashboards into your product. The API supports single sign-on and some customization of colors and logos, but deep white-labeling requires extensive configuration and often custom CSS overrides.
Pricing becomes a friction point quickly. Tableau charges per embedded user or viewer, and costs scale steeply as your customer base grows. ISV agreements can offer volume discounts, but the licensing structure adds complexity compared to usage-based alternatives.
The bigger challenge is deployment overhead. Standing up a truly white-labeled, multi-tenant Tableau environment requires provisioning separate sites or projects per customer, managing permissions manually, and coordinating with your eng team on authentication flows. What looks like a quick embed often turns into a multi-month integration project.
Power BI
Power BI embeds via its Embed for Customers feature, backed by Azure infrastructure. If you're already running on Microsoft's stack, the integration is straightforward: authenticate through Azure AD, provision workspaces per tenant, and serve dashboards via iframe.
Cost savings is the main draw for Microsoft shops. Power BI Premium or Embedded capacity lets you serve unlimited external users for a flat monthly fee, avoiding per-seat pricing that scales with customer count.
The tradeoff is customization. White-labeling options are limited compared to newer tools. You can adjust colors and hide some UI chrome, but the Power BI aesthetic remains visible. For SaaS products aiming for a native look, that friction shows.
Looker
Looker's foundation is LookML, a semantic modeling language that defines metrics and business logic centrally. This governed approach guarantees every team member queries consistent definitions, making Looker powerful for internal analytics where data accuracy and standardization matter most.
The embedding story is less straightforward. Looker's API supports customer-facing dashboards, but implementation demands considerable dev work: writing LookML models, configuring row-level permissions per tenant, and managing complex authentication flows. Most teams find the learning curve steep and the time-to-deploy long compared to tools purpose-built for external embedding.
Mode Analytics
Mode is an analyst-first workspace that combines SQL notebooks, Python scripting, and collaborative reporting. The tool excels when technical users need to write custom queries, run statistical models, and iterate on analysis together in a shared environment.
The interface revolves around code. Analysts write SQL to pull data, pipe results into Python for transformations or visualizations, then package findings into reports. This workflow fits internal data teams well but creates barriers for non-technical stakeholders who expect point-and-click interactions.
Mode offers limited embedding capabilities and lacks the white-labeling features customer-facing scenarios require. You can share reports via links, but dashboards carry Mode's branding and UI. There's no multi-tenant data isolation or custom domain support out of the box, making it a poor fit for external audiences.
ThoughtSpot
ThoughtSpot is focused on search-driven analytics. Users type natural language queries into a Google-style search bar, and the AI engine translates those keywords into charts and tables. The approach works when customers already know what questions to ask and how to phrase them.
The infrastructure demands are considerable. Deploying customer-facing ThoughtSpot instances requires careful capacity planning, especially at scale. Each embedded environment needs dedicated compute resources, and costs rise quickly as query volume grows.
The search approach itself requires onboarding. Unlike traditional dashboards where KPIs are pre-built and visible on page load, ThoughtSpot expects users to initiate exploration by typing queries. That works for power users but can leave casual customers staring at an empty search box, unsure where to start.
Multi-tenancy and white-labeling are possible but add engineering complexity. You'll need to configure row-level security per customer, customize the UI through CSS and branding APIs, and manage authentication flows manually.
Metabase
Metabase is an open-source BI tool that focuses on simplicity. The interface is clean and approachable: point-and-click query builders, a visual dashboard editor, and SQL support for analysts who need it. Non-technical users can build basic reports without writing code.
The self-hosted deployment model is the primary cost advantage. Download Metabase, run it on your own infrastructure, and you're functional with no licensing fees. For teams with engineering resources and modest requirements, this can be a compelling starting point.
Embedding dashboards is supported in the open-source version, but the feature set is minimal. You can iframe public dashboards or use signed tokens for private ones, but you lose white-labeling, custom domains, and granular permission controls. Each dashboard carries Metabase branding unless you upgrade.
The Enterprise edition unlocks white-labeling and better multi-tenancy controls, but pricing jumps considerably. At that point, you're paying enterprise SaaS rates while still managing your own hosting and maintenance.
Explo
Explo is purpose-built for embedding analytics into B2B products. Unlike general BI tools adapted for external use, it starts with the assumption that you're building dashboards for customers, not internal teams.
The dashboard builder is code-optional. Drag components onto a canvas, connect them to your database, and configure permissions through a GUI. For developers, there's a React SDK that gives programmatic control over styling and behavior without the constraints of a pure iframe.
Multi-tenancy is baked into the architecture. Explo handles data isolation automatically once you define which customers map to which data segments. You don't manually configure row-level security per tenant; the tool enforces it based on your customer identifier passed at runtime.
The catch is flexibility. Explo's component library and styling options are opinionated, designed to ship fast instead of matching arbitrary design specs. If your product has unique UX requirements or complex visualization needs, you may hit constraints that require workarounds or custom code.
Solution | Best For | White-Labeling & Customization | Multi-Tenancy Support | Deployment Complexity | Pricing Model |
|---|---|---|---|---|---|
Index | Teams needing fast deployment with AI-powered queries | Full UI customization with custom domains and automatic SSL | Automatic data isolation per customer at query level | Minutes to deploy with iframe or API embedding | Usage-based pricing |
Tableau | Enterprises focusing on visualization quality and interactive features | Limited white-labeling; requires extensive CSS overrides for deep customization | Manual provisioning of separate sites or projects per customer | Multi-month integration project with complex authentication flows | Per embedded user or viewer; scales steeply with customer growth |
Power BI | Microsoft-stack companies seeking cost savings. | Limited customization; Power BI aesthetic remains visible | Workspace provisioning per tenant through Azure AD | Straightforward for Azure environments; iframe embedding via Embed for Customers | Flat monthly fee for Premium or Embedded capacity (unlimited external users) |
Looker | Organizations requiring governed metrics and centralized business logic | API supports embedding but requires considerable dev work | Row-level permissions configured manually per tenant in LookML | Steep learning curve; long time-to-deploy with complex authentication | Enterprise licensing with capacity-based pricing |
Explo | B2B products needing purpose-built customer analytics | Code-optional builder with React SDK; opinionated component library | Automatic data isolation based on customer identifier passed at runtime | Fast deployment with GUI-based configuration | SaaS subscription pricing |
Luzmo | SaaS companies building branded customer portals | Deep customization of colors, fonts, component styles, and chart types | Native multi-tenant architecture with automatic isolation | Visual designer with REST APIs and SDKs for fine-tuning | SaaS subscription pricing |
Metabase | Teams with engineering resources seeking open-source simplicity | Open-source version has minimal white-labeling; Enterprise edition required for full branding | Limited in open-source; Enterprise edition offers better controls | Self-hosted deployment; minimal embedding features without Enterprise upgrade | Free open-source; Enterprise pricing for white-labeling features |
Sigma Computing | Business users comfortable with spreadsheet interfaces | Embedding capabilities exist but are secondary to core product | Requires workarounds and additional configuration for external customers | Optimized for internal use; external embedding not primary use case | Warehouse-based pricing tied to compute usage |
Luzmo
Luzmo specializes in embedded analytics for SaaS companies that need branded customer portals. The dashboard designer is visual and developer-friendly: you can build in the GUI, then fine-tune styling and behavior through REST APIs or SDKs.
White-labeling goes deeper than logo swaps. Luzmo lets you customize colors, fonts, component styles, and even chart types to match your product's design system. The result feels native instead of embedded.
Real-time data integration connects to warehouses, databases, and APIs with automatic refresh scheduling. Customers see live metrics without manual exports or stale snapshots, which reduces support burden and increases trust in the data.
Sigma Computing
Sigma's interface mimics a spreadsheet, letting business users pivot, filter, and aggregate data using familiar Excel-like interactions. Under the hood, queries run directly on your cloud warehouse (Snowflake, BigQuery, or Redshift), so you get warehouse-scale performance without extracting data.
The spreadsheet metaphor lowers the learning curve for internal teams accustomed to working in Google Sheets or Excel. Analysts can drag columns, write formulas, and build charts without learning SQL or a new BI syntax.
Sigma's embedding capabilities exist but remain secondary to its core mission: self-service exploration for employees. Setting up white-labeled, multi-tenant dashboards for external customers requires workarounds and additional configuration that the product wasn't optimized for.
Choosing the Right Customer Dashboard Solution for Your B2B Company
Start by mapping your constraints. If you're shipping a customer dashboard in the next quarter with limited eng resources, you need a solution that works out of the box. Tools requiring LookML modeling or custom authentication flows will blow your timeline.
Consider whether analytics is a core differentiator or table stakes. If it's core to your product's value prop, invest in flexible tools like Explo or Luzmo that offer deep customization. If it's supplementary, focuses on speed and simplicity.
We built Index for teams that need both. You can deploy white-labeled dashboards in days using natural language queries, without sacrificing data isolation or branding control. When time-to-value matters, we're the fastest path from concept to customer-facing analytics.
Final thoughts on embedded analytics for B2B products
Shipping a customer dashboard comes down to matching your constraints with the right tool. If you need white-labeled analytics live in weeks, not quarters, skip the tools built for internal teams and pick something purpose-built for embedding.
Your customers already expect self-service data, and the trend is accelerating: by 2026, over 80% of software vendors will embed AI capabilities in their products with companies expecting 95% of data-driven decisions to be at least partially automated by 2025. Every month you wait is a month your competitors can close the gap.
Start with your timeline, asses what works out of the box, and ship something that proves value at every login.
FAQ
How do I isolate customer data in a multi-tenant dashboard?
The solution should enforce row-level security at the database or query level, automatically filtering data based on the customer identifier you pass at runtime. Look for tools that handle tenant isolation natively instead of requiring manual permission configuration for each customer.
What's the difference between internal BI tools and customer-facing dashboards?
Internal BI tools like Tableau help your employees analyze business performance, while customer-facing dashboards sit inside your product and show each client their own usage metrics with your branding. The key distinction is audience: one serves your team's decision-making, the other delivers value directly to customers.
When should I consider building customer dashboards instead of handling requests manually?
If your support team fields repetitive "how are we doing?" questions or you're spending considerable time generating custom reports for clients, a self-service dashboard will free up those resources. Customer-facing analytics also become important when you need to prove ROI to reduce churn or want to gate advanced reporting as a premium feature.
Can I serve dashboards from my own domain instead of a vendor's URL?
Yes, most modern customer dashboard solutions support custom domains with automatic SSL certificates. Serving from analytics.yourcompany.com instead of vendor.io builds trust and makes the dashboard feel like a native part of your product instead of a third-party embed.
How long does it typically take to deploy a white-labeled customer dashboard?
Deployment time varies widely by solution. Purpose-built tools can go live in days with minimal engineering work, while adapting general BI platforms like Tableau or Looker for customer-facing use often requires weeks or months of configuration, authentication setup, and multi-tenant provisioning.